Using Graduation and Employment Charts to Make Strategic Institutional Decisions
By Dr. Raye Mahlberg, President, Community HigherEd
If your institution is accredited by the Accrediting Commission of Career Schools and Colleges (ACCSC) you probably just went through the process of filling out and submitting Graduation and Employment (G&E) charts. While most see these charts as simply an accreditation requirement for reporting graduation and placement rates, these charts can actually be quite useful for making strategic decisions for your institution.
These reports provide a great way to identify trends and can help make decisions in order to ensure the success of all your schools’ programs.
Before getting into how you can use these charts to make strategic decisions, I think it is important to discuss the timeline for when these reports should be completed. They are due along with your annual report in October, but if you wait till the end of September, or the beginning of October to complete them, you are going to be as much as a year or two behind the curve for making changes to your programs before they affect upcoming reports. Depending on the length of your programs I recommend starting your reports at least one year in advance or at the latest, once the last person that will show up on that report starts their program. By completing the reports far in advance, you will be able to track trends as they happen. Some schools add students to the appropriate chart as they start and are sometimes 2-3 years ahead, but this isn’t a realistic process for everyone. Ultimately, the sooner, the better! Typically these reports are completed by accreditation and compliance directors or by career services. In some cases, they may be completed by institutional leadership. Because these charts hold so much information and can be so useful to an institution, it is important that the charts be shared with all those in decision making positions in order to ensure the institution obtains the most value from the charts. Meet early and often with those that can act on the trends found in the charts.
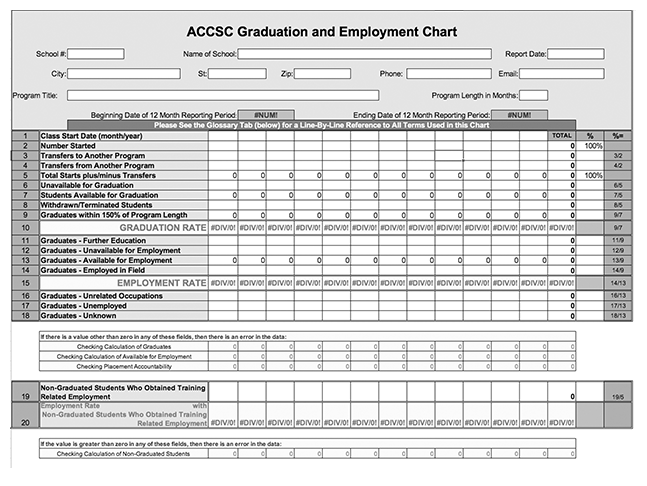
Blank ACCSC Graduation and Employment Chart
Identifying trends
By completing your G&E charts you will be able to identify some trends quickly, others will take a little more digging, but it is a great glance at the health of and outcomes for a particular program. Once you have completed the charts, start by comparing part-time to full-time program outcomes. Are these similar? If not, what could be contributing to the differences? Next look at your cohort start numbers. Are there any months that have higher enrollment than others? We all know higher education enrollment is cyclical, but were there any periods of high enrollment in a non-peak month? I find it helpful to look at a marketing calendar during this step to see if there were any new campaigns that were started within 30-60 days of the enrollment peak. If you have a calendar that shows when you hired new staff or lost staff this can also be helpful for explaining highs, lows, and drops in a program. During this phase, it is also beneficial to look at program transfers. Do you have a high number of students transferring in or out? Other trends that can be seen at first glance include the number of students unavailable for graduation as well as the number of students in continuing education or other waivers. If you have a high number of students seeking continuing education, are they attending your institution or going elsewhere?
Student lifecycle trends
The G&E charts are a great lens to view the student lifecycle through. When looking at the charts, identify any months that had particularly low or high amounts of drops. Even in cases where a program is meeting or exceed retention benchmarks, these patterns can be beneficial for identifying retention problems and making changes to increase student success. If you have a program that has particularly high retention, you may find value in having the department head or instructor present to other faculty on the systems they have in place. If you are noticing students dropping near the beginning of their programs it may be time to revisit your orientation program. If students have a tendency to drop closer to the end of their program, there could be potential issues with the externship or clinical sites. Sometimes a program has particularly high retention but may see a higher number of drops from one particular cohort. This is a great opportunity to dig more into that particular cohort to identify what caused the high number of drops. Digging into these trends cannot only help your institution improve retention, but also improve the student experience overall.
Benchmarks
By completing your reports early on in the process, you will be able to identify programs that may have trouble meeting benchmarks quickly. If you are seeing high numbers of drops, this is a great time to investigate why students are dropping. Your institution may want to consider doing a survey of the students who dropped and act on any trends you may find. If you are able to work quickly, you may be able to have these students re-enroll and complete your program within the same report. For programs showing potential difficulty in placement outcomes, this is the time to become more proactive with career services. A career fair or on-site interviews can help with these numbers as well as one-on-one career counseling.
If you are seeing low placement trends in one particular program, it may be time to do a new market study of the program in your area to ensure there are still enough jobs available in your area for that program.
Sometimes curriculum adjustments may be needed to ensure students are prepared for placement when they graduate. For programs with a high number of open positions in the area but low placement, there could be a lack of confidence or preparedness from graduates, or they may simply just not be aware of all of the opportunities. This is another case where completing the charts early, will be extremely beneficial for the institution. ACCSC is extremely generous with the amount of time given for a student to be placed. Knowing early on about potential problems will ensure the institution can maximize this time.
Involving program advisory committees
Once you have completed your G&E charts, share this information with the institutions Program Advisory Committees (PAC). Particularly in programs where you may see lower trends in placement and graduation, even if they are still meeting benchmarks. PAC members will be a great asset when it comes to adapting programs to the changing needs of the industry as well as assisting with placement problems. As experts in the industry, they are a great group to lean on for advice on how best to proceed, particularly when programs have more than one year in a row in decline of either enrollment, retention, or placement.
When to discontinue a program
Any time the institutions G&E charts show below benchmark retention or placement it is important to evaluate the viability of that program. This is particularly important as you grow closer to the submission deadline. If you have noticed downward trends and you are not going to meet the benchmarks, it is time to put on your strategy hat. Complete a market study for viability, survey your PAC members, and look to the Bureau of Labor statistics and any other local resources you can find for insight as to the viability of continuing a program. Sometimes the answer is a curriculum update, staffing change, or simply a change in delivery method. Other times the market may be flooded, the program needs a complete 180-degree overhaul, or the interest and growth in that field no longer exist. If you have a program that is not viable, you will be much better off making the decision as an institution to discontinue the program rather than being mandated to do so. These are very tough decisions to make but the earlier you can identify these trends the faster you can act.
When to add additional program offerings
The strategic decisions led by your G&E reports are not always bad! Sometimes the data on a report will give you insight as to where to expand programs, add additional delivery methods, or expand staff. Growing trends over time may show that additional staff may be needed to sustain growth. If you have a program that is consistently full, is far above the benchmark in retention, and is above the benchmark on placement you may want to consider adding additional staff and space to increase enrollment in the program. Again, as with making any decisions to grow or remove a program, you will want to do a market study and seek advisory committee feedback to ensure you will not be flooding the market by increasing enrollment. Market trends will also show whether similar program offerings would be beneficial as well as additional diploma or degree options for existing programs.
When it comes to reporting it is all about perspective. When thinking is shifted to encompass the strategic value of G&E charts, institutions can use these charts to guide the process of making strategic decisions about a program. The earlier these charts are completed, the faster trends can be identified. Using these charts as a roadmap for improving student success will not only help the institution raise benchmarks over time but ultimately increase student success and satisfaction.
DR. RAYE MAHLBERG is the President of Community HigherEd in Tulsa Oklahoma. Community HigherEd is a 501(c)(3) and encompasses three colleges, Community Care College, Clary Sage College, and Oklahoma Technical College with programs covering a wide range of disciplines from Allied Health, to Trades, to Cosmetology and Design careers. Dr. Mahlberg has over 17 years of experience working in higher education. She has a passion for helping students graduate and find success in their new careers. Dr. Raye has a MEd in Adult and Higher Education with an emphasis in Student Personnel Services from the University of Oklahoma and a Ph.D. in Higher Education Leadership with an emphasis in Enrollment Management from Capella University. Dr. Mahlberg initially came to the colleges as the Director of Faculty Development and was responsible for new faculty training and curriculum improvements. Following this role, she served as the Campus Director at Clary Sage College for six years before becoming President in August of 2017. Previous positions include serving as an Apartment Community Director as well as Special Programs and Marketing Coordinator at the University of Tulsa and as a Resident Director at Texas A&M Kingsville.
Contact Information: Dr. Raye Mahlberg // President // Community HigherEd – Community Care College, Clary Sage College, and Oklahoma Technical College // 918-610-0027 // rmahlberg@communitycarecollege.edu // http://www.communitycarecollege.edu, http://www.clarysagecollege.com, http://www.oklahomatechnicalcollege.com, http://www.communityhighered.org // https://www.linkedin.com/in/rmahlberg/


