Fall 2020 Postsecondary Enrollments: Down, but Maybe Not as Bad as Expected


By Jeffrey M. Silber and Henry Sou Chien, CFA, BMO Capital Markets
Bottom line
Data collected from a number of sources show that postsecondary enrollments will likely decline this fall, although maybe not as badly as expected. While varying across school types, it appears undergraduate enrollment will be down in the low-single digits y/y, compared with much higher expected y/y declines, boding well for CHGG (although CHGG’s subscriber growth has increased each year despite prior enrollment declines). Graduate enrollment could actually increase y/y, potentially a positive for TWOU. In addition, for-profit schools (as a whole) could gain share for the first time since FY2010, boding well for such companies as APEI and LOPE.
Key points
Preliminary indicators show fall 2020 enrollment declines may not be as bad as expected. While postsecondary enrollment typically increases in a downturn, this fall was expected to be different given the abrupt nature of the downturn, forcing potential students (and parents) to be more concerned with making ends meet rather than continuing their education. Some early surveys projected y/y declines as high as 20%. Data we have collected so far show those fears may not materialize.
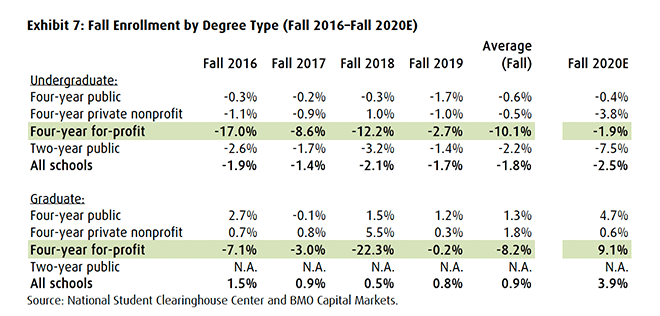
Undergraduate declines could be in the low-single digits. The National Student Clearinghouse Center (NSCC) typically provides the most timely enrollment data, although fall data is usually not released until the semester ends (or is close to ending). Last week, the NSCC posted data from 22% of US higher education institutions, showing a 2.5% y/y decline in the number of undergraduate students. This low-single digit decline is also corroborated by financial aid filings (FAFSA) (down 1.9% YTD). If accurate, this low-single-digit decline would be much less than feared, potentially boding well for Chegg (CHGG), which serves mostly US undergraduate students. CHGG management had previously expected a 5-10% y/y decline, although recently it has been quoted with expectations closer to the lower end of that range. We note that undergraduate enrollment has fallen each year since fall 2010, yet CHGG’s subscriber base has increased each year.
Graduate enrollment could increase this fall. The NSCC shows graduate enrollments up 3.9% y/y (same preliminary data). This corroborates early indicators of strong demand cited by TWOU in recent calls and could foretell better-than-expected graduate program enrollments this fall. We believe this momentum could increase into next year given the typically long lead time from inquiries to enrollment (about three quarters).
For-profit schools could gain share this fall. While the data could be mixed by school, the NSCC showed four-year for-profit undergraduate enrollment down 1.9% y/y with four-year for-profit graduate enrollment up 9.1% y/y. Both were well above their private not-for-profit peers, with the graduate numbers also outperforming public not for-profits (which had been gaining much share in recent years in graduate programs). Among our covered companies, we forecast schools run/serviced by APEI and LOPE will show solid enrollment growth this fall.
Details and Analysis
Historical postsecondary enrollment. According to the NCES, postsecondary enrollment has been declining each year since peaking at just over 21 million in the 2010-2011 school year, with just over 19.6 million students enrolled in the 2018-2019 school year (latest data available). Preliminary data for the 2019-2020 school year from the National Student Clearinghouse showed another 1.3% y/y decline.
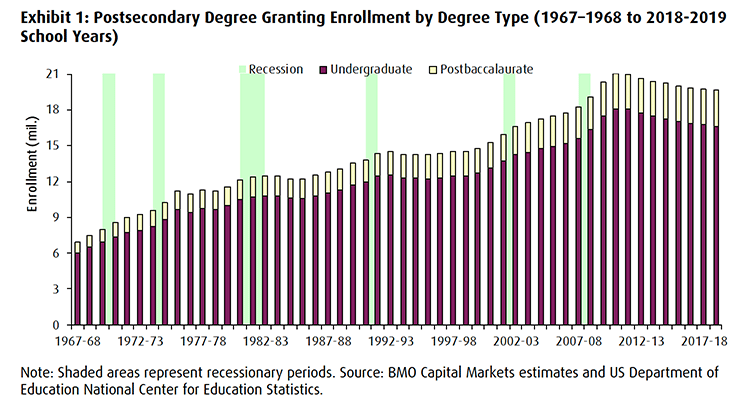
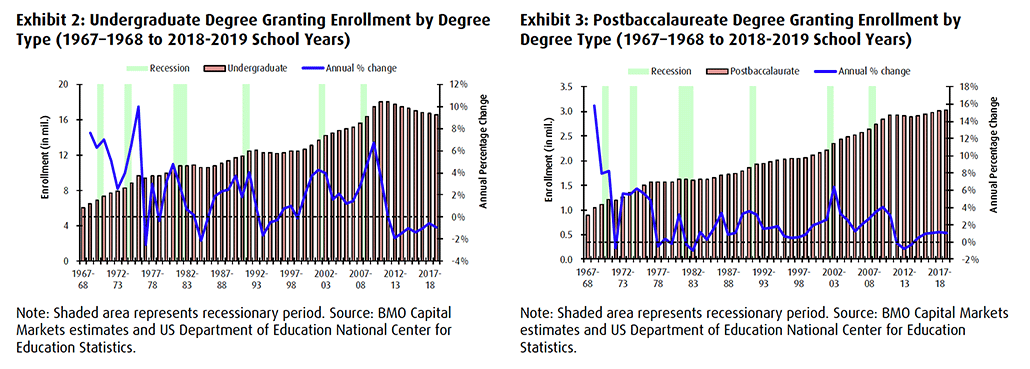
When segmenting enrollment between undergraduate and postbaccalaureate (graduate) students, one can see that much of the decline during the past decade was in the undergraduate population, owing to a combination of demographics as well as the more countercyclical nature of that group (fewer students pursue undergraduate degrees in stronger economies).
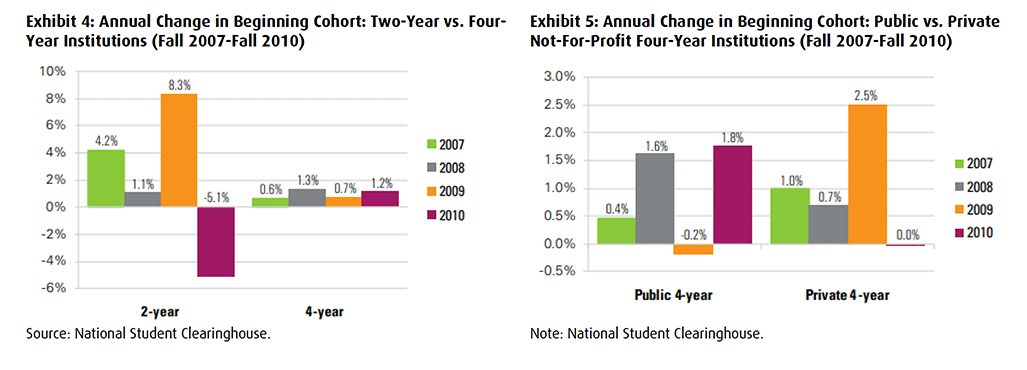
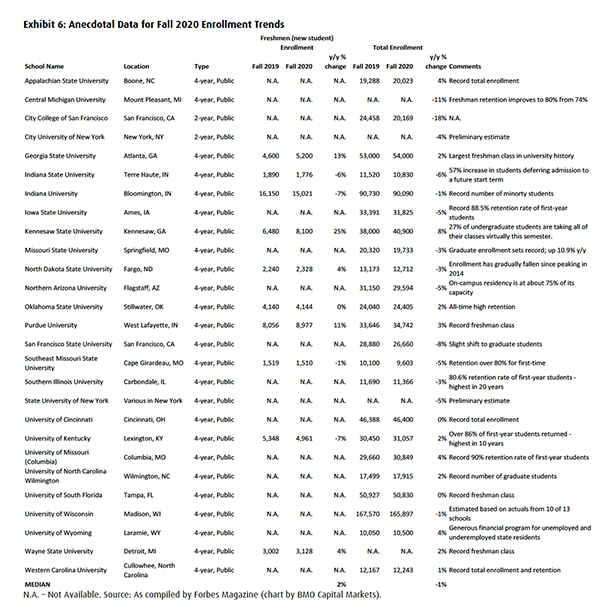
 While conventional wisdom believes a recession is beneficial for college enrollment, that may not be true for all postsecondary institutions. In an April 2020 report by the National Student Clearinghouse, the authors conclude that community colleges (two-year schools) experienced dramatic increases in enrollment after a delay of one to two years, the proportion of students enrolling full time in public four-year institutions saw virtually no change, and four-year private not-for-profit institutions maintained their market share more effectively than was predicted.
 Fall 2020 expectations. There has been much concern that postsecondary enrollments would decline dramatically this fall. As an example, in a July 2020 survey by consulting firm SimpsonScarborough, about 40% of incoming freshmen stated they were likely or highly likely to change their minds about the school they had planned to attend this fall, ranging from 50% at four-year private institutions to 32% at four-year public institutions. This followed the firm’s April 2020 survey where it estimated that enrollment at four-year colleges and universities could decline 20% y/y this fall.
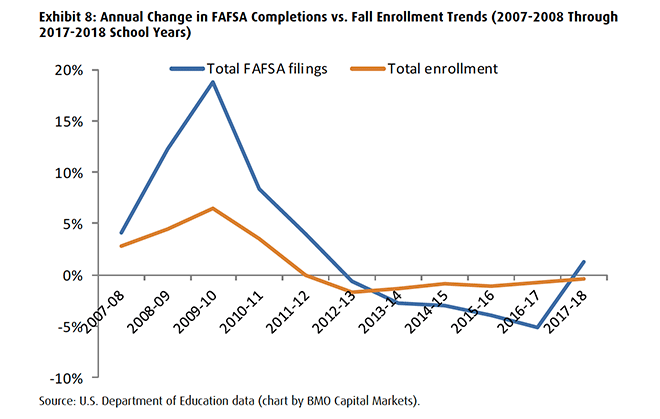
Anecdotal data from some schools (as compiled from school press releases by Forbes Magazine) show those projections to be a bit extreme for the overall sector, although the range is wide. We believe larger financial aid/discounts helped in many cases. In addition, the releases may be skewed a bit as schools with increasing enrollments were more likely to make these early announcements.
 Early fall 2020 indicators. A late-September preliminary report by the National Student Clearinghouse Center using data from about 22% of US institutions, estimated a 2.5% y/y decline in fall 2020 undergraduate enrollments, but a 3.9% y/y increase in graduate enrollments. Surprisingly, the worst performers were public two-year institutions (e.g., community colleges) with enrollments down 7.5% y/y. This group was expected to outperform given that they typically have lower-priced offerings. Data was not provided for postsecondary institutions as a whole, but as undergraduate programs represent about 70% of total students, we would infer a slight y/y decline in total enrollment.
We note the relative outperformance at for-profit schools in both degree types (likely owing to their preponderance of online offerings). If this data holds, for-profit schools could gain share for the first time since FY2010.
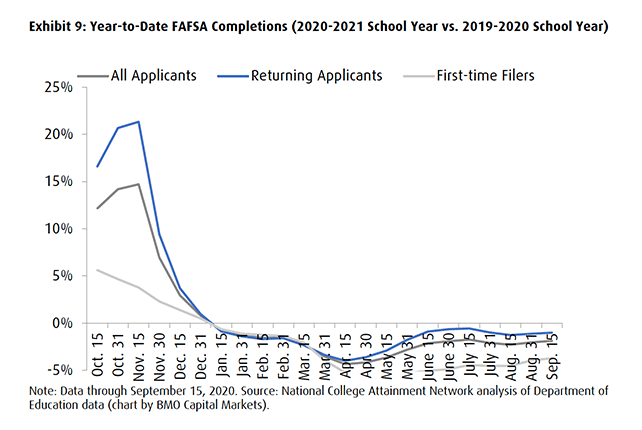
Although historical data is limited, we have found that tracking the number of completed Free Application for Federal Student Aid (FAFSA) forms (needed to apply for federally financed Title IV funds) is typically a fairly good indicator for fall enrollment, although FAFSA filing tends may be a bit more volatile. The bulk of this data represents undergraduate students.
 While trends improved throughout the summer, FAFSA filings are down 1.9% year to date through September 15, 2020. The declines are greater for first-time filers (typically incoming freshmen), which are down 3.7% year to date, while those for returning applicants are down 1% year to date. We believe this shows incoming freshmen enrollment will be more pressured than returning students. We note that CHGG subscribers historically are underrepresented at the freshman level given lack of brand recognition by incoming students.
 Among the reasons for this expected y/y decline in enrollments (particularly undergraduate).
- Increase in “gap year” interest/deferring enrollment. We believe this is a major reason for expected declines in incoming freshmen, although it could apply to existing students as well. Education strategy firm Art & Science LLC has been surveying students planning on entering college this fall to see if their plans have changed during this pandemic. In its April survey, 12% of students had changed their plans. Of that group, 35% were planning to take a “gap year,” up from 16% in its March survey. While this question was not asked in the March survey, 17% of those that stated their plans had changed in the April survey now plan to wait until the spring 2021 semester to enroll full time; i.e., take a “gap semester.” Should this occur, this would mean just over 6% of all students ([35%+17%] x 12%) would not enroll in the fall, about twice the rate of about 3% that typically take time off, per the Higher Education Research Institute at the University of California, Los Angeles. A more recent (late-May) survey conducted by Remote Internships found that 4.3% of those surveyed expected to take a gap year this fall, with the majority expecting to “take a job.”
- Parents’ reluctance. In a late-April survey published by Tyton Partners, more than 40% of parents of college-age students stated they were either uncertain or would not send their child to school for the fall semester in a remote-learning scenario. Of those stating they would not enroll their child this fall, the percentage was the highest among parents of high school seniors (9%).
- More “college openings.” Each year, the National Association for College Admission Counseling (NACAC) tracks the number of colleges and universities that still have openings, financial aid, and housing available to qualified freshmen and/or transfer students. As of May 1, 2020, 706 schools still had openings, compared with 419 schools listed in May 2019. That number increased to around 775 schools by June 1, 2020. While the list is not a pure survey – different colleges respond in different years – it could be another indicator for a tough fall for many schools.
- International enrollments likely to fall. Historically, the US has attracted a proportionately larger number of students from outside the country. According to the Institute of International Education (IIE), there were nearly 1.1 million foreign students enrolled in US postsecondary institutions in the 2018-2019 school year (latest data available), representing approximately 5.5% of the total US postsecondary student population. However, the number of students was relatively flat from the prior year, continuing the slowdown that began following President Trump’s election.
This number will likely get much worse in fall 2020. An IIE survey released in mid-May cited that most (88%) of US higher education institutions anticipate that international student enrollment will decline, with 30% anticipating a “substantial” decline. According to a National Foundation for American Policy analysis released in early July, new international student enrollment at US universities is projected to decline 63% to 98% in the fall 2020-2021 academic year from the 2018-2019 level, with between 6,000 and 12,000 new international students at the low range and between 87,000 at 100,000 at the high range. While we do not believe it will be this dire, nevertheless, this population will be pressured.
While travel restrictions may also limit the number of US students studying abroad, about three times as many foreign students travel to the US compared with US students that study abroad. Although there are estimates that as much as 90% of international students were still “stuck” in the US, we do not believe this will be enough to offset these losses. In addition, given that foreign students studying in the US are generally not eligible for Title IV funding and tend to pay “full price,” this would have a disproportionate adverse impact on the financials of these schools. A late-May survey by NAFSA: Association of International Educators estimated a decline in international students could cost US colleges and universities up to $3 billion in the upcoming school year.
IMPORTANT DISCLOSURES
Analyst’s Certification
I, Jeffrey M. Silber, hereby certify that the views expressed in this report accurately reflect my personal views about the subject securities or issuers. I also certify that no part of my compensation was, is, or will be, directly or indirectly, related to the specific recommendations or views expressed in this report.
Analysts who prepared this report are compensated based upon (among other factors) the overall profitability of BMO Capital Markets and their affiliates, which includes the overall profitability of investment banking services. Compensation for research is based on effectiveness in generating new ideas and in communication of ideas to clients, performance of recommendations, accuracy of earnings estimates, and service to clients.
Analysts employed by BMO Nesbitt Burns Inc. and/or BMO Capital Markets Limited are not registered as research analysts with FINRA. These analysts may not be associated persons of BMO Capital Markets Corp. and therefore may not be subject to the FINRA Rule 2241 restrictions on communications with a subject company, public appearances and trading securities held by a research analyst account.
Company Specific Disclosures
Disclosure 1: BMO Capital Markets has undertaken an underwriting liability with respect to Chegg within the past 12 months.
Disclosure 2: BMO Capital Markets has provided investment banking services with respect to Chegg within the past 12 months.
Disclosure 3: BMO Capital Markets has managed or co-managed a public offering of securities with respect to Chegg within the past 12 months.
Disclosure 4: BMO Capital Markets or an affiliate has received compensation for investment banking services from Chegg within the past 12
months.
Disclosure 5: BMO Capital Markets or an affiliate received compensation for products or services other than investment banking services within the past 12 months from Chegg.
Disclosure 6A: Chegg is a client (or was a client) of BMO Nesbitt Burns Inc., BMO Capital Markets Corp., BMO Capital Markets Limited or an affiliate within the past 12 months: A) Investment Banking Services
Disclosure 8A: BMO Capital Markets or an affiliate has a financial interest in 1% or more of any class of the equity securities of 2U.
Disclosure 8C: BMO Capital Markets or an affiliate has a financial interest in 0.5% or more in the issued share capital of 2U.
Disclosure 9B: BMO Capital Markets makes a market in Grand Canyon Education in United States.
Methodology and Risks to Target Price/Valuation for (APEI-NSDQ)
Methodology: Average of P/E, EV/adjusted EBITDA and discounted cash flow based on forward-looking estimates.
Risks: Unable to meet enrollment goals, changes in regulatory environment for financial aid, increased competition, problems with systems and infrastructure. If these risks are greater than we expect, the stock could have difficulty achieving our target price. Likewise, if less than we expect, the stock could trade above our target price.
Methodology and Risks to Target Price/Valuation for (CHGG-NYSE)
Methodology: Average of EV/revenue, EV/adjusted EBITDA and discounted cash flow based on forward-looking estimates.
Risks: Slower-than-expected growth of digital services; competition.
Methodology and Risks to Target Price/Valuation for (LOPE-NSDQ)
Methodology: Average of P/E, EV/adjusted EBITDA and discounted cash flow based on forward-looking estimates.
Risks: Increased competition, execution risk in migrating to managed services model.
Methodology and Risks to Target Price/Valuation for (TWOU-NSDQ)
Methodology: Average of EV/revenue and discounted cash flow based on forward-looking estimates.
Risks: High start-up costs, intensifying competition, negative perceptions of online learning.
Distribution of Ratings (September 27, 2020)
| Rating Category | BMO Ratting | BMOCMUS Universe* | BMOCM IB Clients** | BMOCM IB Clients*** | BMOCM Universe*** | BMOCM IB Clients*** | StarMine Universe~ |
| Buy | Outperform | 45.7% | 28.5% | 53.2% | 47.5% | 56.9% | 57.7% |
| Hold | Market Preform | 51.8% | 21.0% | 44.4% | 50.2% | 42.0% | 37.5% |
| Sell | Underperform | 2.5% | 23.1% | 2.4% | 2.3% | 1.1% | 4.8% |
* Reflects rating distribution of all companies covered by BMO Capital Markets Corp. equity research analysts.
** Reflects rating distribution of all companies from which BMO Capital Markets Corp. has received compensation for Investment Banking services as percentage within ratings category.
*** Reflects rating distribution of all companies from which BMO Capital Markets Corp. has received compensation for Investment Banking services as percentage of Investment Banking clients.
**** Reflects rating distribution of all companies covered by BMO Capital Markets equity research analysts.
***** Reflects rating distribution of all companies from which BMO Capital Markets has received compensation for Investment Banking services as percentage of Investment Banking clients.
~ As of April 1, 2019.
Other Important Disclosures
For Important Disclosures on the stocks discussed in this report, please go to https://researchglobal0.bmocapitalmarkets.com/public-disclosure/ or write to Editorial Department, BMO Capital Markets, 3 Times Square, New York, NY 10036 or Editorial Department, BMO Capital Markets, 1 First Canadian Place, Toronto, Ontario, M5X 1H3.
Dissemination of Research
Dissemination of fundamental BMO Capital Markets Equity Research is available via our website https://researchglobal0.bmocapitalmarkets.com/. Institutional clients may also simultaneously receive our fundamental research via email and/or via services such as Refinitiv, Bloomberg, FactSet, Visible Alpha, and S&P Capital IQ.
BMO Capital Markets issues a variety of research products in addition to fundamental research. Institutional clients may request notification when additional research content is made available on our website. BMO Capital Markets may use proprietary models in the preparation of reports. Material information about such models may be obtained by contacting the research analyst directly. There is no planned frequency of model updates.
The analyst(s) named in this report may discuss trading strategies that reference a catalyst or event that may have a near or long term impact on the market price of the equity securities discussed. In some cases, the impact may directionally counter the analyst’s published 12 month target price and rating. Any such trading or alternative strategies can be based on differing time horizons, methodologies, or otherwise and are distinct from and do not affect the analysts’ fundamental equity rating in the report.
Research coverage of licensed cannabis producers and other cannabis-related companies is made available only to eligible approved North American, Australian, and EU-based BMO Nesbitt Burns Inc., BMO Capital Markets Limited, Bank of Montreal Europe Plc and BMO Capital Markets Corp. clients via email, our website and select third party platforms.
~ Research distribution and approval times are provided on the cover of each report. Times are approximations as system and distribution processes are not exact and can vary based on the sender and recipients’ services. Unless otherwise noted, times are Eastern Standard and when two times are provided, the approval time precedes the distribution time. For recommendations disseminated during the preceding 12-month period, please visit: https://researchglobal0.bmocapitalmarkets.com/publicdisclosure/.
General Disclaimer
“BMO Capital Markets” is a trade name used by BMO Financial Group for the wholesale banking businesses of Bank of Montreal, BMO Harris Bank N.A. (member FDIC), Bank of Montreal Europe p.l.c, and Bank of Montreal (China) Co. Ltd, the institutional broker dealer business of BMO Capital Markets Corp. (Member FINRA and SIPC) and the agency broker dealer business of Clearpool Execution Services, LLC (Member FINRA and SIPC) in the U.S., and the institutional broker dealer businesses of BMO Nesbitt Burns Inc. (Member Investment Industry Regulatory Organization of Canada and Member Canadian Investor Protection Fund) in Canada and Asia, Bank of Montreal Europe p.l.c. (authorised and regulated by the Central Bank of Ireland) in Europe and BMO Capital Markets Limited (authorised and regulated by the Financial Conduct Authority) in the UK and Australia. Bank of Montreal or its subsidiaries (“BMO Financial Group”) has lending arrangements with, or provide other remunerated services to, many issuers covered by BMO Capital Markets. The opinions, estimates and projections contained in this report are those of BMO Capital Markets as of the date of this report and are subject to change without notice. BMO Capital Markets endeavours to ensure that the contents have been compiled or derived from sources that we believe are reliable and contain information and opinions that are accurate and complete. However, BMO Capital Markets makes no representation or warranty, express or implied, in respect thereof, takes no responsibility for any errors and omissions contained herein and accepts no liability whatsoever for any loss arising from any use of, or reliance on, this report or its contents. Information may be available to BMO Capital Markets or its affiliates that is not reflected in this report. The information in this report is not intended to be used as the primary basis of investment decisions, and because of individual client objectives, should not be construed as advice designed to meet the particular investment needs of any investor. Nothing herein constitutes any investment, legal, tax or other advice nor is it to be relied on in any investment or decision. If you are in doubt about any of the contents of this document, the reader should obtain independent professional advice. This material is for information purposes only and is not an offer to sell or the solicitation of an offer to buy any security. BMO Capital Markets or its affiliates will buy from or sell to customers the securities of issuers mentioned in this report on a principal basis. BMO Capital Markets or its affiliates, officers, directors or employees have a long or short position in many of the securities discussed herein, related securities or in options, futures or other derivative instruments based thereon. The reader should assume that BMO Capital Markets or its affiliates may have a conflict of interest and should not rely solely on this report in evaluating whether or not to buy or sell securities of issuers discussed herein.
Additional Matters
This report is directed only at entities or persons in jurisdictions or countries where access to and use of the information is not contrary to local laws or regulations. Its contents have not been reviewed by any regulatory authority. BMO Capital Markets does not represent that this report may be lawfully distributed or that any financial products may be lawfully offered or dealt with, in compliance with regulatory requirements in other jurisdictions, or pursuant to an exemption available thereunder.
To Australian residents: BMO Capital Markets Limited is exempt from the requirement to hold an Australian financial services licence under the Corporations Act and is regulated by the UK Financial Conduct Authority under UK laws, which differ from Australian laws. This document is only intended for wholesale clients (as defined in the Corporations Act 2001) and Eligible Counterparties or Professional Clients (as defined in Annex II to MiFID II).
To Canadian Residents: BMO Nesbitt Burns Inc. furnishes this report to Canadian residents and accepts responsibility for the contents herein subject to the terms set out above. Any Canadian person wishing to effect transactions in any of the securities included in this report should do so through BMO Nesbitt Burns Inc.
The following applies if this research was prepared in whole or in part by Colin Hamilton, Alexander Pearce, Raj Ray, David Round or Edward Sterck: This research is not prepared subject to Canadian disclosure requirements. This research is prepared by BMO Capital Markets Limited and distributed by BMO Capital Markets Limited or Bank of Montreal Europe Plc and is subject to the regulations of the Financial Conduct Authority (FCA) in the United Kingdom and the Central Bank of Ireland (CBI) in Ireland. FCA and CBI regulations require that a firm providing research disclose its ownership interest in the issuer that is the subject of the research if it and its affiliates own 5% or more of the equity of the issuer. Canadian regulations require that a firm providing research disclose its ownership interest in the issuer that is the subject of the research if it and its affiliates own 1% or more of the equity of the issuer that is the subject of the research. Therefore each of BMO Capital Markets Limited and Bank of Montreal Europe Plc will disclose its and its affiliates’ ownership interest in the subject issuer only if such ownership exceeds 5% of the equity of the issuer.
To E.U. Residents: In an E.U. Member State this document is issued and distributed by Bank of Montreal Europe plc which is authorised and regulated in Ireland and operates in the E.U. on a passported basis. This document is only intended for Eligible Counterparties or Professional Clients, as defined in Annex II to “Markets in Financial Instruments Directive” 2014/65/EU (“MiFID II”).
Singapore: This disclaimer applies to research reports distributed by the Private Banking unit of Bank of Montreal, Singapore Branch (“BMO SG”), an exempt financial adviser under the Financial Advisers Act (Cap. 110) of Singapore (“FAA”) only. This research report is prepared by BMO Capital Markets and distributed by BMO SG pursuant to an arrangement under regulation 32C of the Financial Advisers Regulations of Singapore. This research report is distributed by BMO SG solely to persons who qualify as accredited investors as defined in the FAA only, and is not intended for and may not be circulated to the general public. This report and any information contained in this report shall not be disclosed to any other person. If you are not an accredited investor, please disregard this report. BMO SG does not accept legal responsibility for the contents of the report. Recipients should contact BMO SG at 65-6535 2323 for matters arising from, or in connection with the report.
To U.S. Residents: BMO Capital Markets Corp. furnishes this report to U.S. residents and accepts responsibility for the contents herein, except to the extent that it refers to securities of Bank of Montreal. Any U.S. person wishing to effect transactions in any security discussed herein should do so through BMO Capital Markets Corp.
To U.K. Residents: In the UK this document is published by BMO Capital Markets Limited which is authorised and regulated by the Financial Conduct Authority. The contents hereof are intended solely for the use of, and may only be issued or passed on to, (I) persons who have professional experience in matters relating to investments falling within Article 19(5) of the Financial Services and Markets Act 2000 (Financial Promotion) Order 2005 (the “Order”) or (II) high net worth entities falling within Article 49(2)(a) to (d) of the Order (all such persons together referred to as “relevant persons”). The contents hereof are not intended for the use of and may not be issued or passed on to retail clients.
To Israeli residents: BMO Capital Markets is not licensed under the Israeli Law for the Regulation of Investment Advice, Investment Marketing and Portfolio Management of 1995 (the “Advice Law”) nor does it carry insurance as required thereunder. This document is to be distributed solely to persons that are qualified clients (as defined under the Advice Law) and qualified investors under the Israeli Securities Law of 1968.
This document represents the analysis of the analyst but there is no assurance that any assumption or estimation will materialize. These documents are provided to you on the express understanding that they must be held in complete confidence and not republished, retransmitted, distributed, disclosed, or otherwise made available, in whole or in part, directly or indirectly, in hard or soft copy, through any means, to any person, except with the prior written consent of BMO Capital Markets.
Click here for data vendor disclosures when referenced within a BMO Capital Markets research document.

JEFF SILBER is a senior analyst in BMO Capital Markets Equity Research, covering the business services, industrial services and education sectors, including the staffing, waste services, information services, payroll services and tax preparation industries. Jeff publishes two periodic industry reports: an annual overview of the Education and Training industry (referred to in the industry as “The Bible”) and the Staffing Indicator, on staffing services. Jeff serves as the host and moderator for the firm’s annual Back to School Education Conference, considered the premier investor event for the industry.
Jeff’s research has been recognized by many industry surveys, including the Refinitiv (formerly Thomson Reuters)/StarMine top analysts list, Institutional Investor’s All-American Research team, The Wall Street Journal’s “Best on the Street” Analysts Survey, the Reuters survey of small- and mid-cap fund managers, and the Zacks.com All-Star Analyst team. Jeff has won a StarMine Analyst Award for ten straight years (2011-2020), including being named the #1 Stockpicker in the Diversified Consumer Services sector for three years in a row (2017-2019).
Prior to joining BMO Capital Markets, Jeff was a director of Deloitte & Touche PeerScape Services. Prior to that, he worked at Deloitte Consulting and was an accountant with KPMG Peat Marwick. Jeff joined BMO Capital Markets in 1996.
Jeff holds an MBA in marketing and finance from the Wharton Business School and a bachelor of science in accounting from Yeshiva University. He is also a CPA.
Contact Information: Jeffrey M. Silber // BMO Capital Markets // Managing Director, Business and Industrial Services and Education Research // 212-885-4063 // jeff.silber@bmo.com // https://capitalmarkets.bmo.com/en/

HENRY SOU CHIEN, CFA joined BMO Capital Markets in 2013 as a research associate covering the Business & Industrial Services and Education sectors, including the staffing, information services, payroll services and environmental services industries. Prior to this, he covered the market structure industry as a research analyst at TABB Group. Earlier, he worked at Oppenheimer and Standard Chartered Bank. Henry received a BA in Ethics and Political Philosophy from Brown University. Henry is a Chartered Financial Analyst (CFA) charter holder.
Contact Information: Henry Sou Chien, CFA // Equity Research Analyst // BMO Capital Markets // 212-885-4138 // henry.chien@bmo.com // https://capitalmarkets.bmo.com/en/