
Boost Retention While Building Community – Assess and Improve Institutional Retention


By Elizabeth Keifer Herron, VP – Solutions & Sales, Collegiate Admission and Retention Solutions (CARS)
Why do individuals pursue post-secondary education? Is it because they have nothing better to do than to apply to college, work really hard while in college, while juggling other responsibilities and accumulate student loan debt? No; individuals pursue post-secondary education to increase their short- and long-term-earning potential and to improve their lives. Many individuals are following a dream, while others pursue post-secondary education out of necessity, looking for a new job or career.
In a recent study by the College Board, “Education Pays 2016 – Benefits of Higher education for Individuals and Society,” one can see that both lifetime earnings and annual median earnings increase with each level of education attained.
Source: https://trends.collegeboard.org/education-pays
Source: https://trends.collegeboard.org/education-pays
With such obvious benefits, it should be easy to enroll and retain students through to graduation, right? Further, when they graduate and find work, it should be no problem for them to pay back their student loans, correct again? If only it were that easy. Let’s take a look at a recent study from the National Center for Education Statistics “Graduation Rates for Selected Cohorts.”
Title IV starts with completion within 150 percent – 2008 and 2001 cohorts
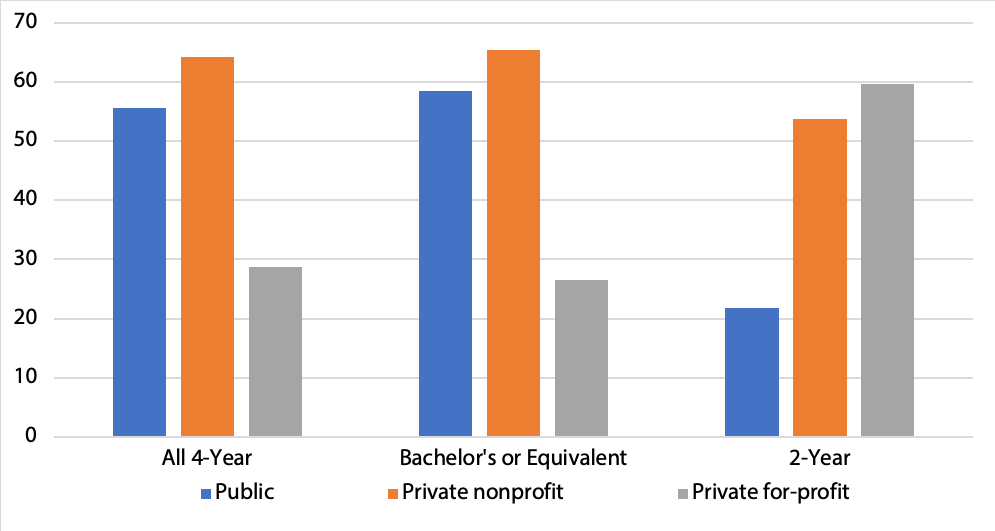
Source: www.nces.ed.gov/pubs2015/2015181.pdf
You can see the tremendous disparity between the completion rates across type and control of institution, as well as the length of the program. While private for-profit institutions boast the greatest completion rates for two-year programs, their success rate with four-year or bachelor’s degrees is less than half their counterparts. What is the cause for attrition, and what can institutions do to stop it?
Institutions with selective application and enrollment processes will almost always have higher overall graduation or completion rates, but the population served by the institution weighs more heavily in the statistics. Students with one or more risk factors for attrition will be harder to retain through to graduation, more difficult to place in jobs, and are more likely to default on their student loans.
The link between attrition and default
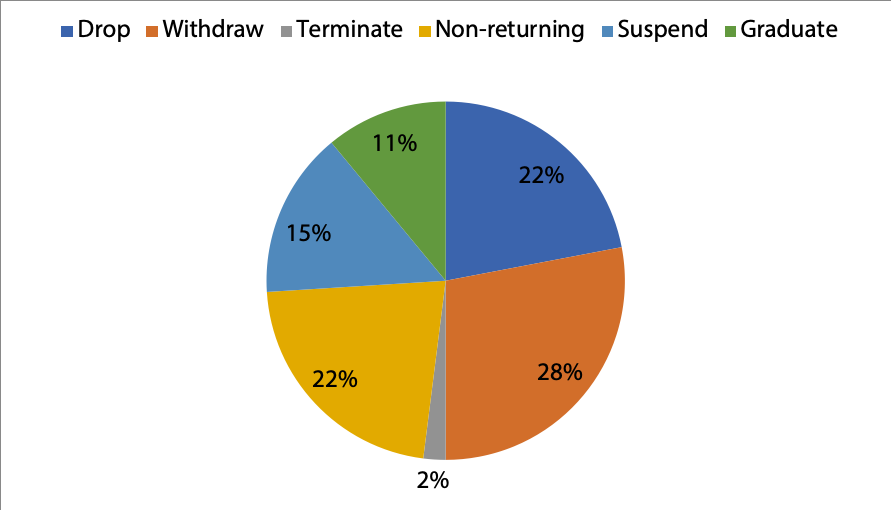
CARS analyzed the enrollment status upon separation of five thousand students who defaulted on their student loans (using data from its clients’ FY2013 cohort default rates). Only 11 percent of the defaulters had a status of graduation/completion. The most recent “official” cohort default rates also show different outcomes by type and control, largely due to populations being served. The overall national average FY2015 cohort default rate was 10.8 percent; the private for-profit average was 15.6 percent.
Source: https://www2.ed.gov/offices/OSFAP/defaultmanagement/schooltyperates.pdf
While addressing retention will not “solve” your cohort default rate challenges, it will go a long way toward driving down those rates while your completion rates rise. To address retention, you will need to:
- Assess and measure student retention
- Identify two or three key initiatives you will adopt and implement
- Design and implement your plan
- Evaluate results and build a continuous improvement process
Measuring retention – when, who and how?
When deciding how to improve retention, you must first establish a baseline so goals for improvement can be established. The most agile and adaptive model to deploy will provide quick feedback for your team and reduce the cycle time of the continuous improvement process as a term retention model. We strongly recommend you begin with a term one retention model, then later move to term-to-term retention.
TERM 1 RETENTION MODEL
Net completers at the end of Term 1
Gross Enrollments in Term 1
Beyond the overall term one retention rate, many institutions will find it useful to evaluate by program, by start-date, by lead source/admissions representative, or perhaps even by instructor. By looking at a year or two of data, you may be able to see trends or problem areas that will guide you toward one or two key initiatives to adopt and implement. Creating a team with representation across all departments will improve the diversity of ideas and solutions presented.
Deploy a risk factor “scoring” for attrition
We have already discussed the population served by the institution affects the graduation and default rates. While financial, academic, work conflict, commitment or dissatisfaction with the program are common reasons non-completers provided at exit, studies show that individual risk factors are more likely contributors to attrition. According to the National Center for Education Statistics (NCES), the following are the primary risk-factors contributing to attrition (Source: https://nces.ed.gov/das/epubs/2002169/risk.asp):
- Delayed enrollment;
- Independent status;
- Number of dependents;
- Being a single parent;
- Lack of a high school diploma or GED in lieu of a high school diploma;
- Enrollment status (part-time is at higher risk than full-time); and
- Ethnicity (Caucasian and Asian heritage is a lower risk than African-American or Hispanic).
By working with many institutions to support retention, CARS has identified a larger list of indicators for attrition and has developed a risk factor “weighting” or scoring model (see the chart below). This chart also includes an “O” or “S” by the risk factor, to assist with determining if this is an objective, data-driven factor, or a subjective, relationship-driven factor. The nature of the risk factor dictates the best approach for supporting the student.
When students have more than one risk factor, the level of effort required to prevent attrition increases exponentially. Consider a student who is a first-generation student in college, prior drop/re-enroll, has a low GPA, SAP problems and a lack of confidence/comfort in school; resulting in a weighted risk score of 3.4. This student may sound like many of your students, but that would fall into the “high” risk area and warrant a significant amount of additional support.
When we look at student population overall, there are those students who will succeed with little, if any, attention, some will withdraw regardless of what you do, and a significant portion are a medium- to high-risk and will require constant coaching and support to make it through to graduation. By evaluating the range in risk scores for your institution, you can determine how best to allocate resources and design your implementation model for both proactive and reactive counseling and intervention.
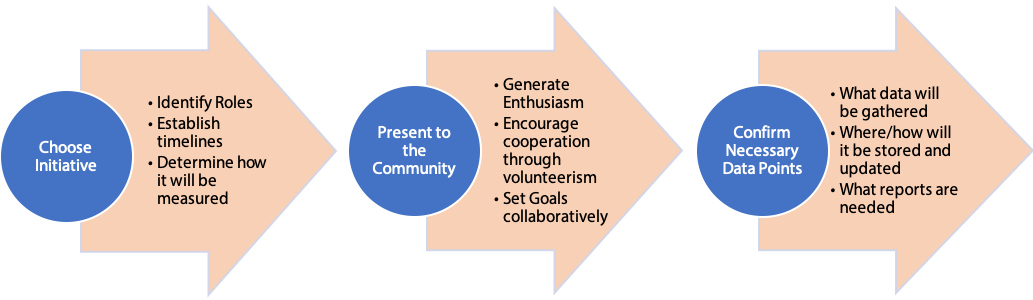
Community-based student engagement model
When creating your cross-departmental team for student success, it is important to remember that if everyone is responsible, no one will be responsible. Roles must be clearly defined, goals must be outlined and metrics to evaluate success must be identified, monitored and evaluated. We cannot expect what we do not inspect!
At each point in the student life-cycle, members of your team will build a relationship with the student. Information about the student’s goals, fears, concerns and strengths will be gathered and should be documented. While objective risk factors are easy to see (grades and attendance), sometimes the underlying risk factors are what must be addressed to solve the problem (cultural fit, health issues or lack of family support).
As risk factors present themselves, different members of the team should be assigned to support and provide solutions, although there should be one primary student success advocate to whom the student can turn for guidance.
Establishing a proactive outreach plan for all students
When building your community-based engagement model, it is critical to reach out to all students at key points to build rapport and show that you care. When a proactive plan is deployed, students are more likely to reach out when they need help and more receptive to interventions that become necessary. It is best to utilize a variety of methods to make contact, including email, calls, text and face-to-face meetings. CARS suggest the following proactive outreach schedule:
- Future start welcome call – to new students prior to term start, welcoming them and keeping them engaged while awaiting term start
- Term introduction call – to all students prior to term start, make sure they’re ready; conduct risk assessment, build rapport, etc.
- Orientation call (if applicable) – to all students during orientation window, for curriculums that require an online orientation to stay enrolled; call to make sure they get it done in the allotted time
- Check-in call – good to conduct near midterm exams to ensure students are prepared, studying, don’t have any issues; address risk factors and student profile notes, updates
- Re-registration call – announce registration for next term is open and encourage early re-registration
- Check-in/end of term call – check on preparation for finals, they’ve re-registered for the next term, and continue coaching plan by addressing risk factors
Establishing a reactive or “risk-score flag” plan
Utilizing your ongoing risk-score assessment and feedback from members of your team (instructors, financial aid, student success coaches), other interventions may become necessary. CARS deploys reactive outreach in the following situations, to name a few:
- Grades – determine the threshold (grades below 65 percent) and contact to determine cause and address as needed, create awareness of academic warning/suspension possibility and effects
- Attendance – determine the threshold (CARS suggests missing three days – in the classroom or last login – and for online campuses also looking at inactivity of seven-plus days) and contact to address attendance requirements from the syllabus, determine cause and address as needed
- Other/Instructor Identified/Subjective – may include behavioral, participation or other identified issues causing declined quality, frustration or possible withdrawal
- Withdrawal – upon withdrawal, contact student for up to 90 days to identify the cause, provide support and encourage re-enrollment
Evaluate results and continuous improvement plan
What was your improvement goal from historic to post-implementation term one retention? Did you meet your goal? If so, celebrate your success with your entire community! Meet with your student success team and solicit feedback from the team members responsible for the implementation and delivery to identify success or hurdles with deployment. If the goal was not reached or challenges were presented, plan how you address these shortcomings. Review the results and planned changes with the entire faculty and staff to build organizational awareness and to solicit other ideas. Finally, implement the changes and repeat the cycle.
The most important resource at any institution is its human capital. Each and every member of your team has the ability to build a relationship with your students that could mean the difference between graduations and a great career or withdrawal and student loan default. Take advantage of this resource, challenge them toward continuous improvement and see an improvement in your community and your retention rate.

ELIZABETH KEIFER HERRON, a member of the executive management team of CARS, leads the independent third-party verification line of services. In addition, Elizabeth provides client services, community outreach, and is the chief compliance specialist for CARS’ family of companies. Serving on numerous higher education associations’ committees, she is a much sought-after presenter at many workshops and conferences. Her presence in Washington, D.C. enables her to access up-to-the-minute information on a variety of legislative and regulatory issues affecting the post-secondary industry. A founding member of the CARS’ family of companies, Elizabeth’s prior experience included chief lobbyist for the Career College Association (now CECU). She received her BA with honors in Political Science and Economics from Douglass College of Rutgers University and resides in Washington, D.C. with her husband and two boys.
Contact Information: Elizabeth Keifer Herron // Vice President – Solutions & Sales // Collegiate Admission and Retention Solutions (CARS) // 202-558-2337 // ekherron@collegiatersvp.com // www.collegiatersvp.com // https://www.linkedin.com/in/elizabeth-herron-446595/