
The Hidden Motivations of Prospective Students – New Research


By Shane Sparks, Co-founder, Enrollment Resources
Enrollment Resources recently compiled data from over 125,000 prospective students who had completed a detailed online survey delving into their goals, frustrations, motivations and current life/work situations. We call this the “Career Training Readiness Quiz” (powered by our Virtual Adviser software). It is designed to do two things: Engage prospective students on the school’s website to help generate additional leads – typically a 30 percent bump in website generated lead flow – and help the prospective student understand if they are a fit for vocational education. Roughly 2.2 percent of unique visitors to a typical school’s website will engage with this survey.
The sample represented about 90 school systems across the U.S. and Canada with a wide variety of programs, including both male- and female-dominated programs.
Our analysis of the results has uncovered fascinating insights into career education prospective students, including where they are in their buying process, their dominant personality styles and how to communicate with them effectively, and the number one motivating trigger driving their buying decisions.
Pipeline
How long have you been thinking about going back to school?
- I’ve been interested in this field for some time – 67.0%
- I’m just starting my research – 50.9%
Sixty-seven percent of prospective students identified as having been interested in the field of study for some time, while 51 percent were just starting their research. What this suggests is that the typical prospect has been thinking about a career change for some time but is at the beginning of their online buying journey. This is an essential clue to their motivation because it suggests most prospective students sit with the idea for some time before taking action. Schools can use this in their admissions process by asking questions such as: Why did they wait so long to do something about it? What has changed in their life?
The truism in admissions is that a prospective student takes action typically only after there’s some catalyst in their life, which is true for most buying decisions. For example, we drive past the gym for some time before we actually become a member. This data strongly suggests this is true for a majority of prospective students.
Work situation
Current work situation
- Working – 65.8%
- Not working – 34.2%
Are you HAPPY with your current work situation?
- Yes – 16.2%
- No – 35.8%
- It’s OK – 48.0%
A year from now if nothing changed, would you feel…
- Frustrated. I do not want to be in the same situation a year from now. – 60.1%
- About the same. I’m not getting ahead, but not falling behind. – 25.2%
- Content. My career is heading in the right direction. – 14.7%
Sixty-six percent of prospective students were working however only 16 percent were happy with their work situation. 85 percent identified that a year from now if nothing changed they would feel either frustrated or about the same.
What this suggests is that despite a very hot employment market and lower unemployment nationally, a healthy chunk of prospective students are not working, and career dissatisfaction is the primary motivation for seeking career training.
It’s not a big surprise, but what perhaps is telling is that this hasn’t changed much over the past year. As unemployment has declined, career dissatisfaction has remained mostly steady. This suggests that focusing on improvement and career satisfaction, whether working or not working, is a better line of marketing compared to a focus on getting back to work or solving an unemployment crisis.
Motivations
Top changes prospects desire is some combination of
- Work that interests me – 54.7%
- Opportunity for advancement – 55.4%
- Better pay – 51.7%
Goals
- Fulfillment – the number one goal in all cases – #1
- Making a difference (female-dominant programs) – #2
- Money (male-dominant programs) – #2
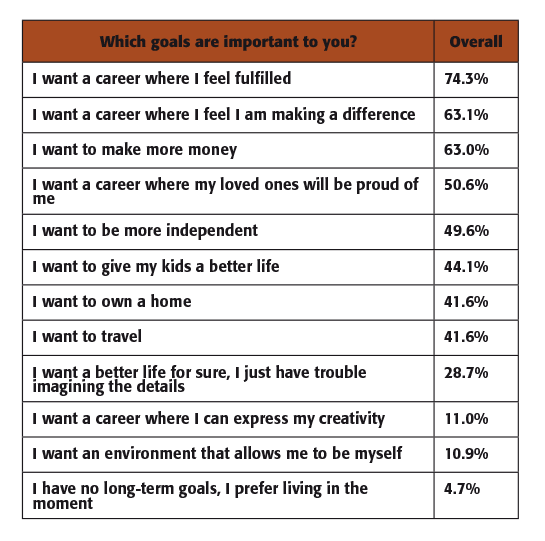
The top motivations for prospects were a combination of “work that interests me,” “the opportunity for advancement,” and “better pay.” Some combination of these were always the top choice of prospective students regardless of the institution or the program.
The number one goal in all cases, for all schools or programs, was fulfillment. The number two goal in all cases was either “making a difference” or “more money.” Making a difference was dominant in female-majority programs such as Allied Health, where “more money” was dominant in more male-majority programs such as HVAC or Automotive.
This part is the most fascinating to us because it seems to confirm a motivation that falls under traditional gender roles. Prospects are all seeking fulfillment, and it’s our job to articulate what that could look like. Women are generally seeking fulfillment through emotional impact which they defined as making a difference, whereas men generally seek fulfillment through providing and financial security or their protector instincts.
The implication of this is around how we tell their stories, how we present our institutions, and how we seek to demonstrate emotional impact.
If indeed we’re all seeking fulfillment, which itself is a nebulous and difficult term to define, the question is how do we communicate fulfillment to our prospective students?
This could be done through examples, stories, case studies, and before and after examples. A major job of your marketing department, and by extension, the admissions department, is to communicate to prospective students how they can achieve fulfillment in ways they can relate too.
Personality makeup
Social style
- Expressive – 51.3%
- Analytical – 22.5%
- Amiable – 13.9%
- Driver – 12.3%
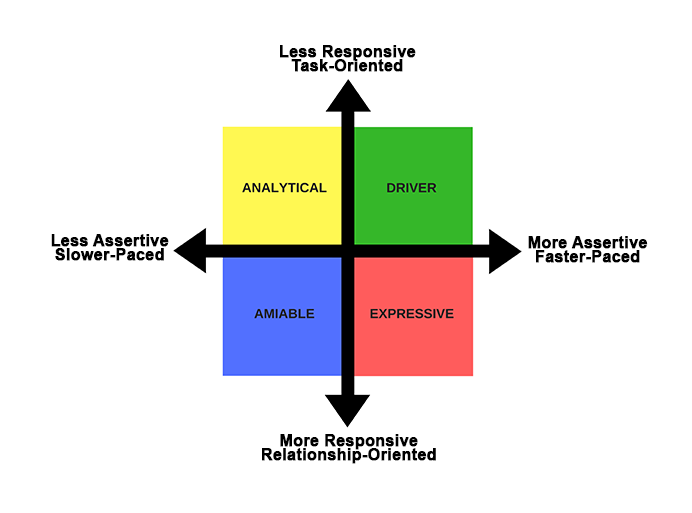
In the career readiness quiz, we use a personality assessment based on the social styles model. People are identified as being in one of four quadrants: Analytical, Driver, Amiable, or Expressive.
- Analytical: Serious and more exacting
- Driver: Strong willed and more emotionally controlled
- Amiable: Easy-going and more supportive
- Expressive: Outgoing and more dramatic
We found that 51 percent of prospective students were identified as Expressive, meaning they are outgoing and relate well interpersonally with others. The typical admissions advisor is also an Expressive type of personality – it’s just the nature of the role. Interestingly, 23 percent of prospective students were identified as Analytical. There is a disconnect between the personalities of nearly a quarter of student prospects and the admission’s team. This poses an interesting admissions challenge.
Analytical and Expressive types do not relate well to each other. Their default social styles put them at odds. For example, an Analytical person takes a lot longer to come to a buying decision than an Expressive. Analytical types collect concrete data, comparison shop, and mull over pros and cons lists. In conversations with an Expressive admissions advisor, these prospective students appear to dither about coming in for a tour or setting a hard and fast appointment.
Without empathy for the needs of the Analytical, the Expressive advisor relies on techniques that make the prospective student uncomfortable. The advisor, unable to find common ground, writes them off.
The reality, however, was that the prospective students just needed a little more information, reassurance, and patience to move to the next step comfortably.
Of the remainder of those surveyed, 14 percent identified as Amiable, and 12 percent as Driver. The vast majority of career education prospective students are Expressive or Analytical. We expect that lead to enrollment conversion rates are influenced by these differences in social styles (though we can’t tell through this particular data set). The opportunity for schools that can convert the less outgoing personality types is worth some thought in your institution.
Revenue implications
While this data gives us some clues on what is making prospects tick, this is where the rubber meets the road: The average school website converts about 2.38 percent of unique visitors to inquiry. At a typical school, that means that for every 1,000 people who come to your website, 24 will make an inquiry. The average for the schools that we work with is 6.02 percent. So, for that same thousand website visitors, our typical client is generating 60 inquiries. The difference in inquiries represents somewhere between two and three enrollments per 1000 unique visitors. You can do the math for your school.
The look and feel of those two websites aren’t so different. The primary difference is the copy, content, and overall persuasiveness of the site.
Persuasive communication is primarily a function of writing, empathy, and the ability to speak directly to the inherent need, desire, and motivation of your prospective student. It is powerful stuff. The typical school could increase their lead flow and enrollment by merely communicating in a persuasive and empathetic way. In the above example, applying the insights from this research, the difference for a small school would be $30,000-$50,000 in tuition revenue per month.
Summary
Understanding the hidden motivations of your target audience is essential to your school’s marketing and enrollment success. Fortunately, over 125,000 prospective students from about 90 school systems across the U.S. and Canada told us who they are. They told us how to create trusting, empathetic and supportive relationships with their potentially clashing personalities. They showed us exactly what they need to feel comfortable moving forward in their enrollment decision. And they outlined how to create meaningful marketing messages that resonate with their hidden goals, frustrations and motivations.
The choice to apply or dismiss these insights will be the only difference between the winners and losers.
To view an example of the “Career Readiness” Quiz visit: https://cr-master.4.virtualadviser.com/register. If you’d like to learn more about how your school can leverage Virtual Adviser to increase lead flow, please contact us.
All content is © Enrollment Resources Inc and may not be duplicated or copied.

SHANE SPARKS specializes in measurable marketing programs, leading our fulfillment team to create measurable, effective campaigns. He is also co-creator of ER’s proprietary Enrollment Management Scorecard Process (EMScorecard™) – a benchmarking business process that helps schools identify money lost in their marketing and admissions departments (usually hundreds of thousands of dollars) AND provides an actionable, realistic plan to recapture the lost revenue. Shane is a former award-winning creative director who lost faith in the impractical and widespread waste of the advertising industry.
Contact Information: Shane Sparks // Co-founder & COO // Enrollment Resources // 250-391-9494 // info@enrollmentresources.com // www.enrollmentresources.com // www.linkedin.com/in/shanemsparks