Analysis of the Impact of Career Colleges and Universities in the U.S. Labor Market
By Career Education Colleges and Universities, Reprinted with Permission
Career Education Colleges and Universities
1101 Connecticut Avenue, NW
Suite 900
Washington, DC 20036
Research and Analysis by Wallace K. Pond, Ph.D. and Ian Creager, BA
Introduction
The American higher education system is the envy of the world and has been since the early 20th century. In addition to the quality education and research in American post-secondary institutions, we also have the greatest diversity of any higher education system in the world. There are currently over 7,000 accredited institutions of all kinds, from community colleges to land grant state universities; from small liberal arts colleges to career and vocational schools; from large online universities to professional medical and law schools; from elite, private institutions to four year state universities. This diversity is critical, not just because of the broad variety of institutional missions which support a rich, diversified economy and society, but because the tremendous diversity across institutions of post-secondary education provides equally diverse opportunities for students, for whom a “good match” is always available at any stage of life.
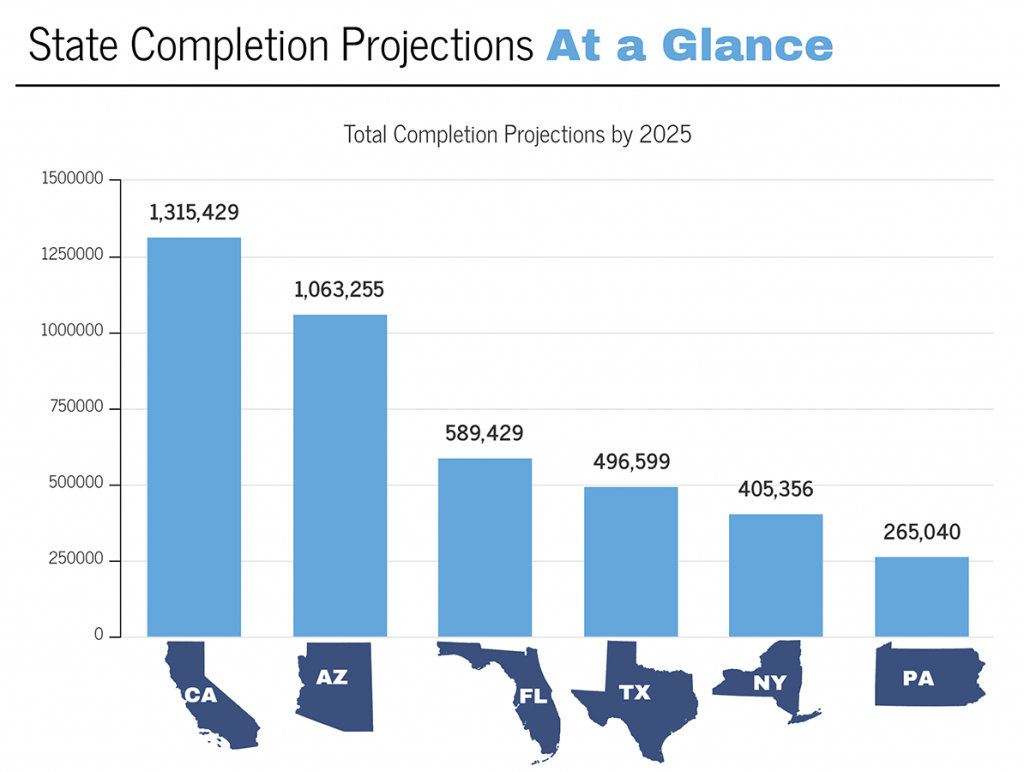
American higher education is also critical for training highly skilled workers across an equally diverse economy. In the United States, students are fortunate to have access to programs ranging from highly applied short-term, diploma or certificate programs, to full degree programs from associate through doctoral levels. This is only possible because of the existence of multiple sectors within higher education. As it relates to job preparation in the early 21st century, the most important sector may be career colleges and universities. This notion is supported by analysis of federal Integrated Post-Secondary Education Data System (IPEDS) and Bureau of Labor Statistics/Projections Central (BLS) data, which clearly show a critical relationship between program offerings at the institution level with job and career opportunities in the workforce. In fact, in many career areas, a majority of workers are trained in private sector career colleges. The data also show that the highest risk and minority students are significantly more likely to complete programs in private sector institutions than students with similar risk profiles in traditional, typically not-for-profit institutions. In short, the data clearly demonstrate that career colleges and universities have historically contributed to the training of millions of individuals who are currently working in the fields for which they trained and, through 2025, the sector is projected to 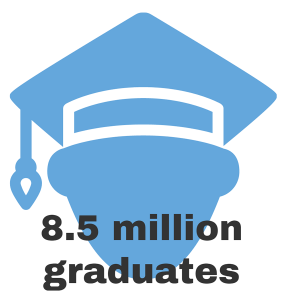 prepare nearly 8,500,000 workers for critical jobs across all 50 states in the U.S. economy. This projection is almost certainly conservative since the baseline number for the projections is based, in part, on 2015 completion data, which reflect the low point of graduates over a five year historical period, and because the growth projections are based on aggregate state government estimates of both replacement needs and new job creation in existing fields. In other words, private sector institutions are likely to respond quickly to market opportunities that arise over the next eight years that are not currently part of BLS projections, but that will ultimately be part of overall job creation during the same time frame.
We believe that our analysis is unique, if not unprecedented, in its breadth, depth and methodology, and provides a compelling window into the role of career colleges and universities as well as a comparison of all three higher education sectors (private, for-profit; private, not-for profit; and public, not-for-profit). The analysis includes:
- a five-year historical review of federal completion data for private sector institutions across all institutions, programs, and states;
- a “cross-walk” connecting Department of Education Classification of Individual Program (CIP) program completion data with Bureau of Labor Statistics Standard Occupational Classifications (SOC) projections, across all 50 states and all programs for which there is a cross-walk match;1
- a comparison of graduate contribution to the labor force by higher education sector using CIP academic program codes.
In short, we believe this is the first analysis to show the relative historical and likely future contribution of private sector career colleges and universities, across all 50 states, and all program areas identified by the U.S. Department of Education, related to job categories as defined by the U.S. Department of Labor.
Executive summary
Private sector colleges and universities (career colleges) have played a critical role in preparing Americans for technical careers for over a century and have existed within American higher education since the founding of the republic.
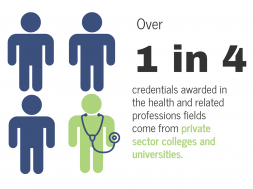
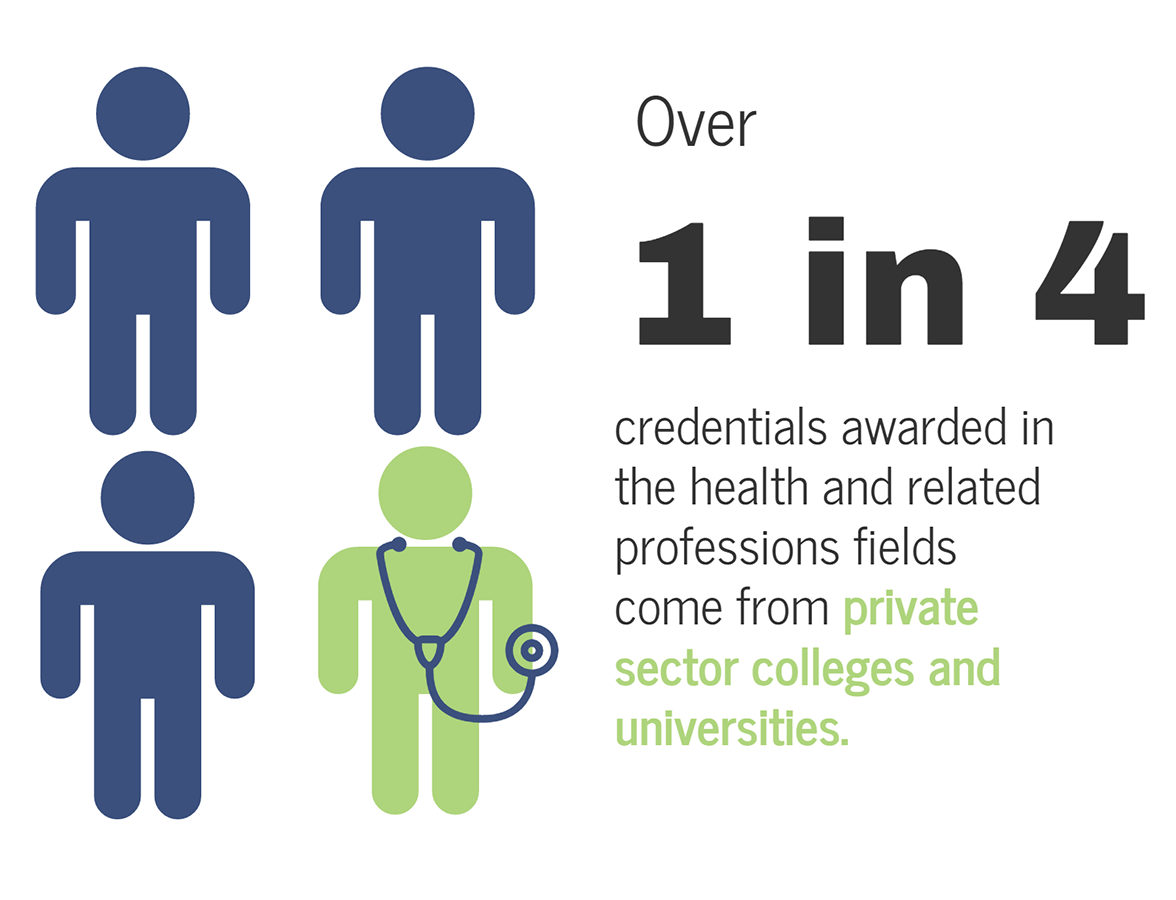
 In many cases, such as in certain allied health, transportation, culinary arts, cosmetology, IT, and electronics fields among others, a large majority of workers in given job categories have been and currently are trained in career colleges and universities. It is fair to say that without the contribution of career colleges and universities to the work force, entire industries would be at risk, and some, would lose access to in excess of 80 or 90 percent of their trained workforce. In many other cases, the sector contributes critical numbers of graduates that, although not a majority, are essential to the industries in question. For example, out of all credentials awarded in the health and related professions fields, 1 in 4 came from private sector colleges and universities.2
In total, this analysis of federal data (IPEDS and BLS), reveals that over the last five years, private sector career-focused institutions have produced 4.13 million highly trained graduates for hundreds of high demand careers.3 It would be difficult to overstate the critical impact these institutions and their graduates have had on local, regional, and national economies.
Of potentially greater significance, our analysis, based on a sophisticated, program level, 50 state “cross-walk,” of IPEDS education data and BLS/Projections Central labor projections, suggests that from 2016 through 2025, career colleges will produce nearly 8,500,000 graduates in critical career fields identified by the federal Bureau of Labor Statistics.4 Moreover, using Department of Classification of Individual Program (CIP) codes, the research reveals that there are 95 program categories in which private sector career colleges graduate between half and ALL of the students trained for those fields. A high level summary of the cross-walk is available in Table 1.
The role of career colleges and universities in preparing students for the job market
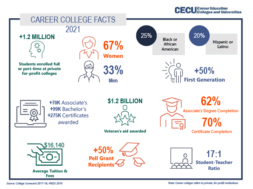
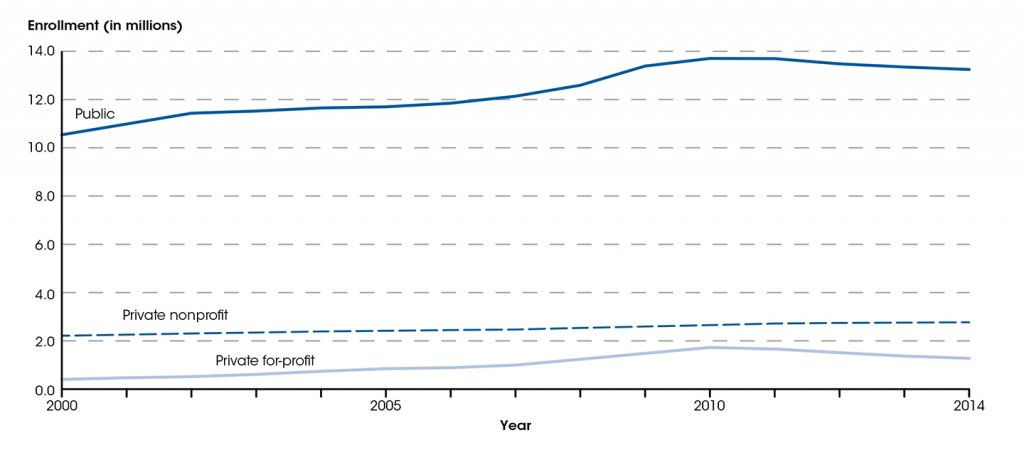
As of 2014, degree granting career colleges in the U.S. served approximately 1.3 million undergraduate students, which is roughly 7.5 percent of 17.3 million total undergraduates in degree programs.5 In all of higher education, including non-degree and graduate programs, enrollment in private sector institutions is approximately 11 percent of all post-secondary students. In 2015, career colleges in the U.S. graduated approximately 700,355 students, which is roughly 14 percent of all post-secondary graduates. It is noteworthy that private sector career colleges produce a disproportionately high number of graduates relative to enrollment because of higher retention and completion rates, particularly in comparison to community colleges.
The most recent National Center for Education Statistics (NCES) sector enrollment percentages are displayed in Figure 1. Additional data is available via the link in the footnote.
Undergraduate enrollment in degree-granting postsecondary institutions, by control of institution: Fall 2000–2014
NOTE: Data include unclassified undergraduate students. Degree-granting institutions grant associate’s or higher degrees and participate in Title IV federal financial aid programs.
See Digest of Education Statistics 2015, table 303.70.
Figure 1
Due to the number of students served by career colleges, particularly in some fields where most graduates come from private sector institutions, combined with the lack of excess capacity in the “traditional” higher education sector, there is presently no viable alternative for training millions of students in many important industries such as allied health/nursing, transportation, cosmetology, culinary arts, and many IT and vocational fields such as HVAC, airframe mechanics, and auto and diesel repair, among others.
Graduate data for 2 015 which identify program areas in which roughly one quarter to nearly all national graduates produced by private sector schools are highlighted in Table 2.
It is important to note that we sorted and analyzed the data at both the categorical two-digit CIP code level; as well as the individual, program-specific six-digit CIP code level.6 In effect, two digit codes refer to program categories and related jobs (System, Networking, and LAN/WAN Management/Manager) whereas six digit codes typically refer to individual programs and specific jobs (Network Administrator). In both cases, the analysis reveals the significant impact that private sector career colleges and universities have in workforce development. However, the six-digit analysis reveals the criticality of the sector for certain positions. For example, 90% of all professional divers, including underwater welders and other commercial diving specialties are educated at private sector career institutions. Many bridges, nuclear power plants and dams, among other structures, rely on professional divers that are educated primarily at career colleges.
Impact of career colleges and universities in future labor force development
According to the BLS data, the U.S. labor force will need workers to fill approximately 46,500,000 jobs through 2024, of which roughly 35,300,000 are replacements for retiring “baby boomers” and about 9,300,000 will be newly created jobs.7 Over that same time period, based on current state-level job outlook trends, private sector career colleges and universities will produce 8,423,511 technically trained total graduates, or nearly one fifth of the entire projected growth.
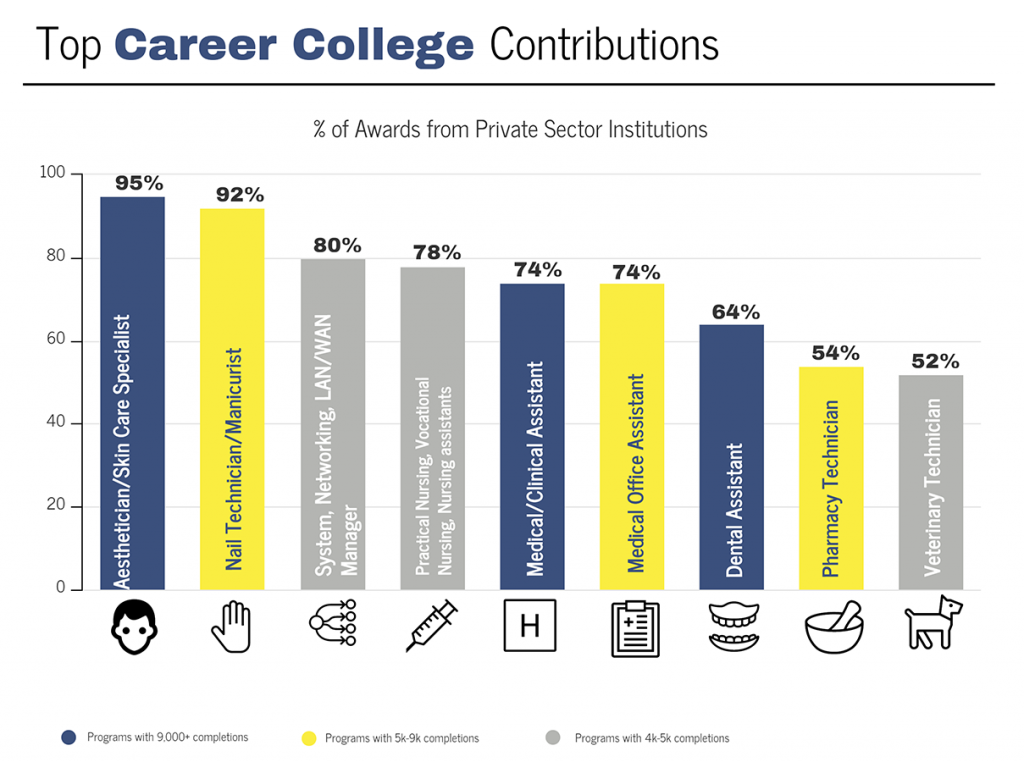
According to the BLS, “Healthcare support occupations and healthcare practitioners and technical occupations are projected to be the two fastest growing occupational groups during the 2014 to 2024 decade. These groups are projected to contribute the most new jobs, with a combined increase of 2.3 million in employment, representing about 1 in 4 new jobs.”8 Approximately 36 percent of all career college and university graduates in the coming decade will be in health fields with some positions, such as medical assistants (74 percent), massage therapists (83 percent), practical nursing, vocational nursing and nursing assistants (78 percent), and dental assistants (64 percent), being almost totally supplied by career colleges. As previously noted, over one in four of ALL graduates in U.S. higher education health care programs attended private sector career colleges and universities in 2015 and those percentages are likely to be stable over the next decade.
It is clear that projected labor needs cannot be met in the U.S. without the critical contribution of private sector colleges and universities, which represent approximately 11 percent of all higher education capacity in the U.S. and, historically, have shown much greater ability to quickly increase capacity than have traditional institutions of higher education. As it relates to the period 2014-2024, according to the BLS, 11 of the 15 fastest growing employment areas will require some level of post-secondary education and public and private not-for-profit institutions are not capable of meeting even a fraction of the existing need in nearly 100 academic program areas served primarily by private sector career colleges and universities, let alone the incremental capacity that will be required to meet job preparation over the next 10 years.9
In fact, the top 12 projected growth fields for career colleges, with BLS projected growth rates ranging from 27 percent to 48 percent over the next 10 years, all correlate with fields in which at least one third (and in some cases over 90 percent) of all higher education graduates nationally are produced by those same career colleges.10 In short, nearly 3.7 million of the jobs that comprise the projected growth of the top 12 career fields over the next 10 years will have to come from career colleges and universities in order to meet the projected labor needs. Table 2, above, outlines top professions where the large majority of workers are graduates of private sector career colleges and universities.
Comparison of graduates by higher education sector
As noted previously, across all of higher education in 2015, private sector career colleges and universities produced 14 percent of all graduates. Among the top 10 graduate producing programs in private sector schools, the lowest percentage contribution to total national graduates was for registered nurses at 16 percent and the highest percentage contribution was for massage therapists and aestheticians/skin care consultants respectively at 83 percent. Four of the top 10 programs produced between 64 percent and 83 percent of all the graduates in those fields nationally. In short, approximately one sixth of all registered nurses produced nationally come from private sector colleges and universities, as do nearly one half of all truck and commercial drivers, nearly three quarters of all medical assistants, two thirds of all dental assistants, over three quarters of all vocational/practical nurses and nurse assistants, and over four fifths of all massage therapists and aestheticians.11 In effect, in the absence of these institutions, many industries would simply collapse for lack of a trained workforce. And the U.S. would experience an epic crisis relative to direct patient care across virtually all health care settings.
Impact of private sector career colleges and universities on society
While this analysis has focused primarily on the role that private sector higher education has and will play in the labor force, and concomitantly in the U.S. economy, the data reveal another compelling reality, which is the absolutely essential role the sector continues to play in quality of life and societal infrastructure and security.
In fact, in some cases, the impact is life or death. A significant share of private sector career college graduates complete healthcare programs: 39 percent of surgical technologists, 43 percent of ultrasound technicians and over one half of pharma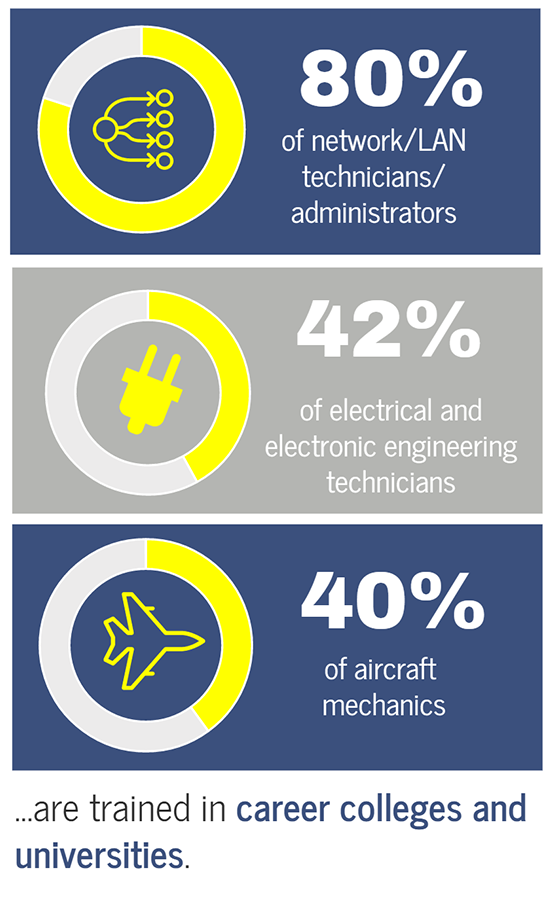 cy technicians from career colleges and universities.
As it relates to societal infrastructure, 80% of network/LAN technicians/administrators, 42% of electrical and electronic engineering technicians, 55% of HVAC engineering technicians, nearly half of all commercial and truck drivers, 40% of aircraft mechanics, and nearly 30% of auto and diesel mechanics are trained in career colleges and universities. In short, key facets of U.S. communications, information technology, physical plant, and transportation infrastructure are dependent on private sector colleges and universities and their graduates to function on a daily basis.
There are also many industries favored by consumers that may not be as critical in the sense of health, safety, or infrastructure, but that are equally dependent on private sector institutions for their survival. Ninety-five percent of cosmetologists/aestheticians, 89 percent of barbers, 83 percent of massage therapists, nearly 60 percent of bakers and pastry chefs, and over half of veterinary technicians are trained in private sector colleges and universities. From a quality of life perspective, most Americans probably see haircuts and spa treatments, massages, care for their pets, and baked goods and pastries as relatively important in their lives—and consumers spend hundreds of billions of dollars annually on these products and services.
Conclusions and implications
Our analysis of federal IPEDS and BLS data suggests several significant, if not critical, findings.
First, nearly one fifth of all the post-secondary graduates necessary to fill the projected 46,500,000 job openings through 2024 will be trained in private sector career colleges and universities. Due to the nature of programs in these institutions, the sector plays a disproportionately significant role in work force development nationally.
Second, using Department of Education data, there are nearly 100 academic program (CIP) codes, which correlate to BLS Standard Occupational Classification (SOC) codes, in which between approximately one half and all national graduates come from career colleges and universities. Some industries, such as allied health and dental fields, culinary arts, cosmetology, transportation, and certain vocational trades are dependent on these institutions for their workforce, and in some states, such institutions provide a majority of all graduates for essential fields.
Third, although private sector colleges and universities represent 11 percent of student enrollment, they produce 14 percent of graduates because their retention and graduation rates are higher for diploma and two year programs than is the case in the other two sectors of higher education and dramatically higher than in public, not-for-profit community colleges.
The cross-walk analysis, connecting Department of Education data with Bureau of Labor Statistics data, provides comparisons of the contributions each higher education sector (private, for-profit; private, not-for-profit; and public, not-for-profit) makes to the workforce via graduates, and importantly, it facilitates projections by sector as well through 2022, which our analysis extended to 2025. Those projections, based on five-year trends (2011-2015), coupled with BLS growth projections, provide a unique and detailed look, by program and by state, across all three higher education sectors.
What the data clearly tell us is that all three sectors are essential in achieving the huge projected labor force needs of the next decade. The data also tell us that in certain program areas (and their related career fields), employers are largely or wholly dependent on private sector career colleges and universities for their highly trained work force.
This analysis also directly challenges the current popular notion, perpetuated by certain regulators, elected officials, and media outlets that private sector career colleges and universities are, broadly speaking, “diploma mills” or worse, based on an innately fraudulent model. Although there are certainly examples of unacceptable practice in some private sector institutions (as there likely is in all sectors of higher education), the data make it clear that entire industries, as well as the consumers of those industries’ products and services, depend on a labor force comprised broadly or entirely of credentialed, and often licensed, graduates who attended private sector career colleges and universities. It is therefore mathematically impossible that such broad based charges against the sector are in any way systemically accurate.
In short, due primarily to massive retirements, but also as a result of the creation of over 9,300,000 entirely new jobs through 2024, U.S. institutions of higher education will need to produce 46.5 million graduates who are job ready at graduation to support hundreds of career fields, and by extension, regional and national economies. There is simply no way to meet the needs of workers, employers and the economy without robust contributions from all three higher education sectors. As such, all three sectors must be assertively supported as a matter of policy, with specific attention paid to career colleges and universities that produce highly trained, job-ready graduates for many fields in which there is no viable alternative.
Our economic future depends on it.
Summary of methodology
Complete data: http://www.career.org/researchdata.html
Data Sources: National Center for Education Statistics (NCES) – Integrated Postsecondary Education Data System (IPEDS)
Postsecondary Education Data System (IPEDS) https://nces.ed.gov/ipeds/datacenter/
The following Complete Data files were downloaded from IPEDS for years 2011 through 2015:
- Institutional Characteristics Surveys
- Completions Surveys
- CIP-SOC Crosswalk*
Projections Central
http://www.projectionscentral.com/Projections/AboutLT
State level employment projections by SOC code administered by the State Employment Security Agency in cooperation with the Bureau of Labor Statistics (BLS). The most recent complete data set available:
4. 2012-2022 Occupational Projections (State Level Annual Growth and Replacements)
Methodology:
Data loaded into Microsoft Access Database – All 4 complete data files above were loaded into Access DB from which data queries were built and exported into Excel. (5 Yr Historical Completions and 10 Yr Projected Completions)
One to Many CIP-SOC Relationships – Most academic programs (CIPs) align with not just one, but many related occupational categories (SOCs). In these instances, a weighted average of growth in all corresponding occupational categories was used to determine projected completions.
3% “No Match” CIP-SOC – Some programs (CIPs) are too general or too specific for a specific corresponding occupational categories (SOCs) and have “No Match”. Around 3% of For-Profit Sector academic programs fall into this category and were not included in projections.
No Projections Data Available for WV and MI – These two states did not have any job projections data on the Projections Central Website. Pennsylvania state projections data used instead for more accurate completions projections.
*CIP-SOC Crosswalk – A publicly available guide developed between NCES and BLS to map academic programs to corresponding jobs.
CIP = “Classification of Institutional Program” (IPEDS); SOC = “Standard Occupational Classification” System (BLS)
Resources
- Individual state projections are compiled by “Projections Central,” http://www.projectioncentral.com, on behalf of the BLS; Projections Central State Occupational Outlook (BLS) 2012-2022: http://www.projectionscentral.com/Projections/AboutLT
- Using 2015 IPEDS data, calculated as a percentage share of total completions under the two-digit CIP code 51—Health Professions and Related Programs. Full data here: http://www.career.org/researchdata.html
- IPEDS source data; Completions Surveys 2011-2015: https://nces.ed.gov/ipeds/datacenter
- The current BLS projections run through 2022. We extended the graduate projections to 2025 using existing IPEDS graduation rates combined with BLS growth percentages. Full data here: http://www.career.org/researchdata.html
- U.S. Department of Education, National Center for Education Statistics: http://nces.ed.gov/programs/coe/indicator_cha.asp
- Example of 2 digit and related 6 digit CIP categories in the IT field: 11 – COMPUTER AND INFORMATION SCIENCES AND SUPPORT SERVICES; 11.1001 – Network and System Administrator. Full data here: http://www.career.org/researchdata.html
- http://www.bls.gov/emp/ep_table_110.htm
- http://www.bls.gov/news.release/pdf/ecopro.pdf
- http://www.bls.gov/news.release/pdf/ecopro.pdf
- Growth rates calculated off of state-level “Average Annual Openings” (2012-2022, http://www.projectionscentral.com/Projections/AboutLT) which includes job openings from both occupational growth as well as replacements.
- Using 2015 IPEDS data, calculated share of total completions using relevant six-digit CIP codes. Registered nursing percentage calculated using six-digit CIP codes 51.3801 and 51.3899. Full data here: http://www.career.org/researchdata.html
