
The 2016 Higher Education Benchmarks


A Keypath Education White Paper Reprinted with Permission
Keypath Education has released its second annual higher education benchmarks to provide institutions with current trends and sector metrics.
The macro picture for postsecondary education reveals continued challenges in student enrollment. Most segments of the market remain flat or down year over year; however, there are pockets of growth and opportunity. Institutions can use the 2016 Higher Education Benchmarks to measure performance, understand marketing trends, gauge the competitive landscape and set goals for the coming year. The report not only covers enrollment, marketing and conversion trends, but also delves into the top academic programs, social media usage and more specifics.
This article contains selected data sets and discussion from the white paper; download the full resource here: http://key.pe/25NWVoB.
Enrollment trends
The U.S. Department of Education’s National Center for Educational Statistics released the third year of Integrated Postsecondary Education Data System (IPEDS) data, which features Fall 2014 trends in distance education enrollment. This most recent available IPEDS data shows that while we’re at a time of decreasing overall enrollments, distance education enrollments are growing, with one in seven students exclusively enrolled in distance education.
Fully distance education enrollments are growing at the greatest rate, 6.6 percent from 2012-14, according to IPEDS. Enrollment in some distance education grew by 4.1 percent during the two-year period. Private, nonprofit institutions continue to grow their exclusively distance education enrollments at the highest rate of 22 percent, while for-profit institutions have seen an 11 percent decline during the same period.
Education marketers and enrollment managers know nontraditional, adult students desire online courses, but a 2015 Eduventures survey of prospective undergraduate students revealed that traditional students are starting to shift their preferences and expectations as well. From 2014-15, there was a 10 percent decrease in students who expected to take 100 percent of their courses on campus.
What are the overall domestic enrollment trends?
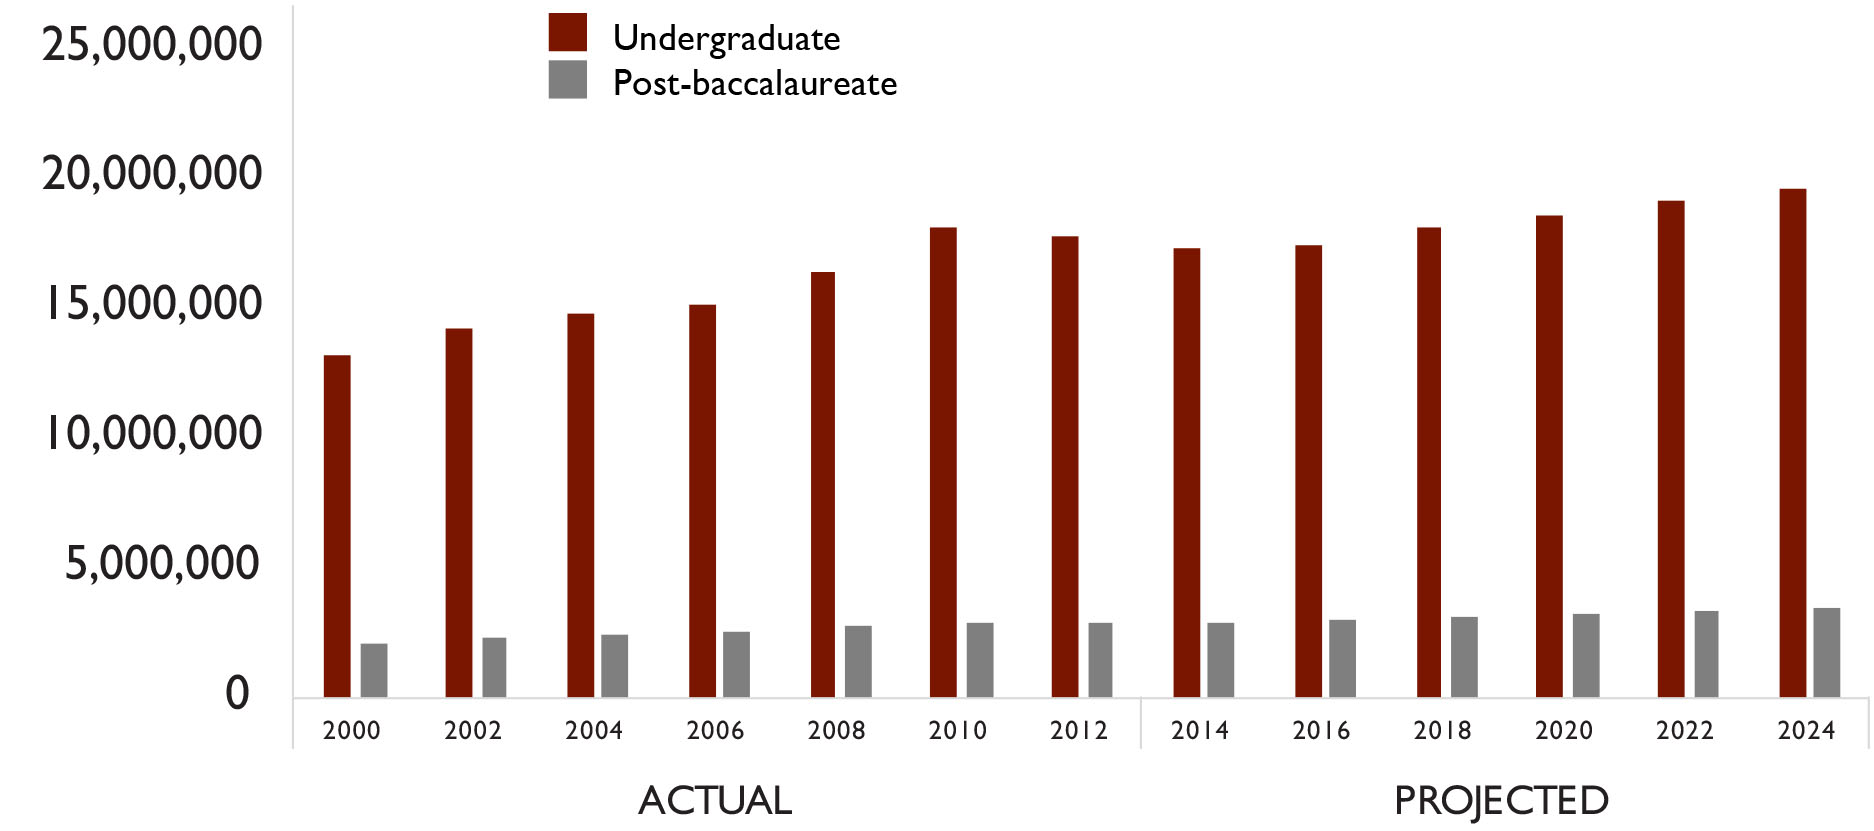
Source: IPEDS. Total undergraduate fall enrollment in degree-granting postsecondary institutions, by attendance status, sex of student, and control and level of institution: Selected years, 1970 through 2024. Total post-baccalaureate fall enrollment in degree-granting postsecondary institutions, by attendance status, sex of student and control of institution: 1967 through 2024.
What is the percent change in enrollment by sector from 2014-15?
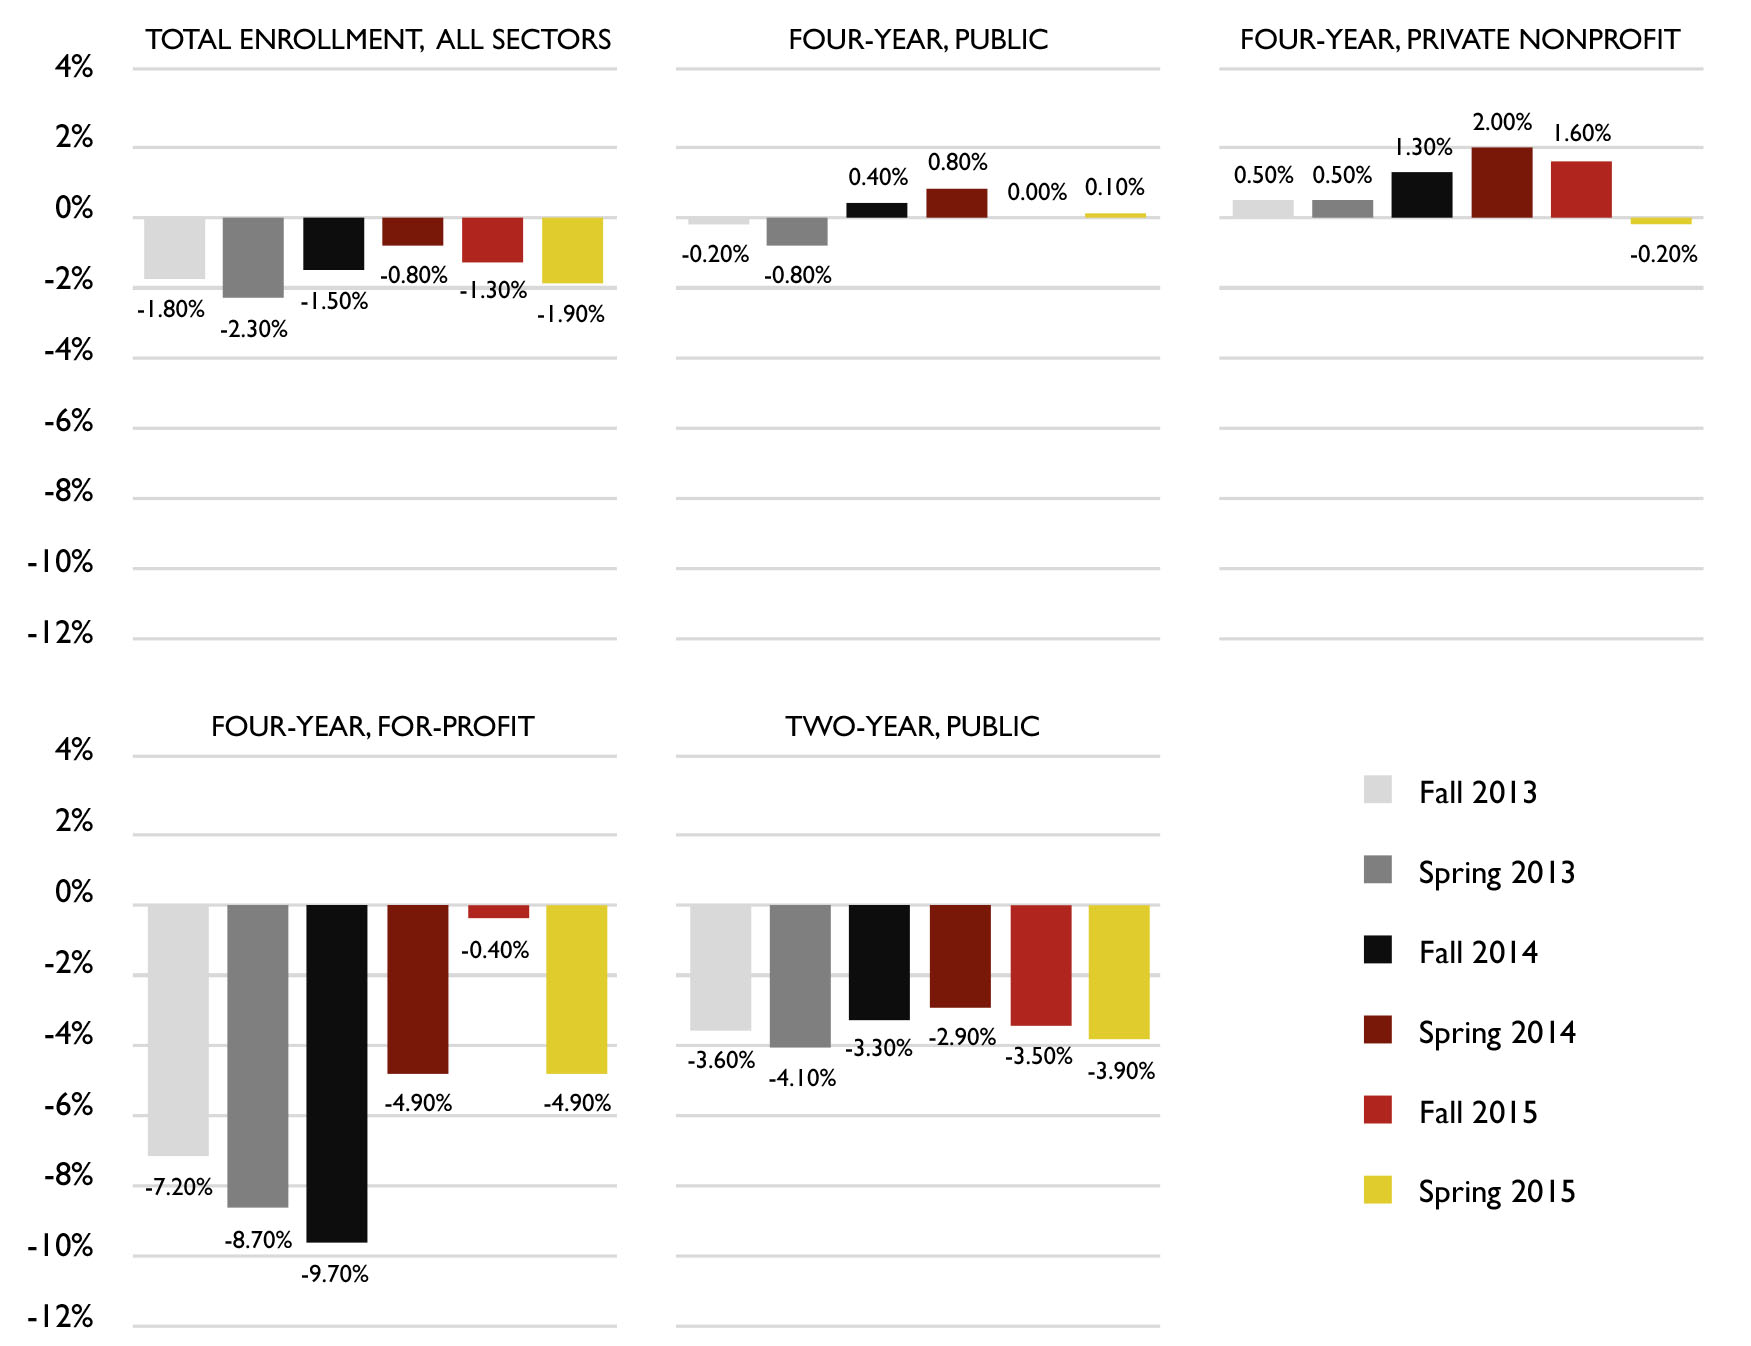
Source: National Student Clearinghouse Research Center. 2015.
What is the growth rate of online enrollments versus program offerings?
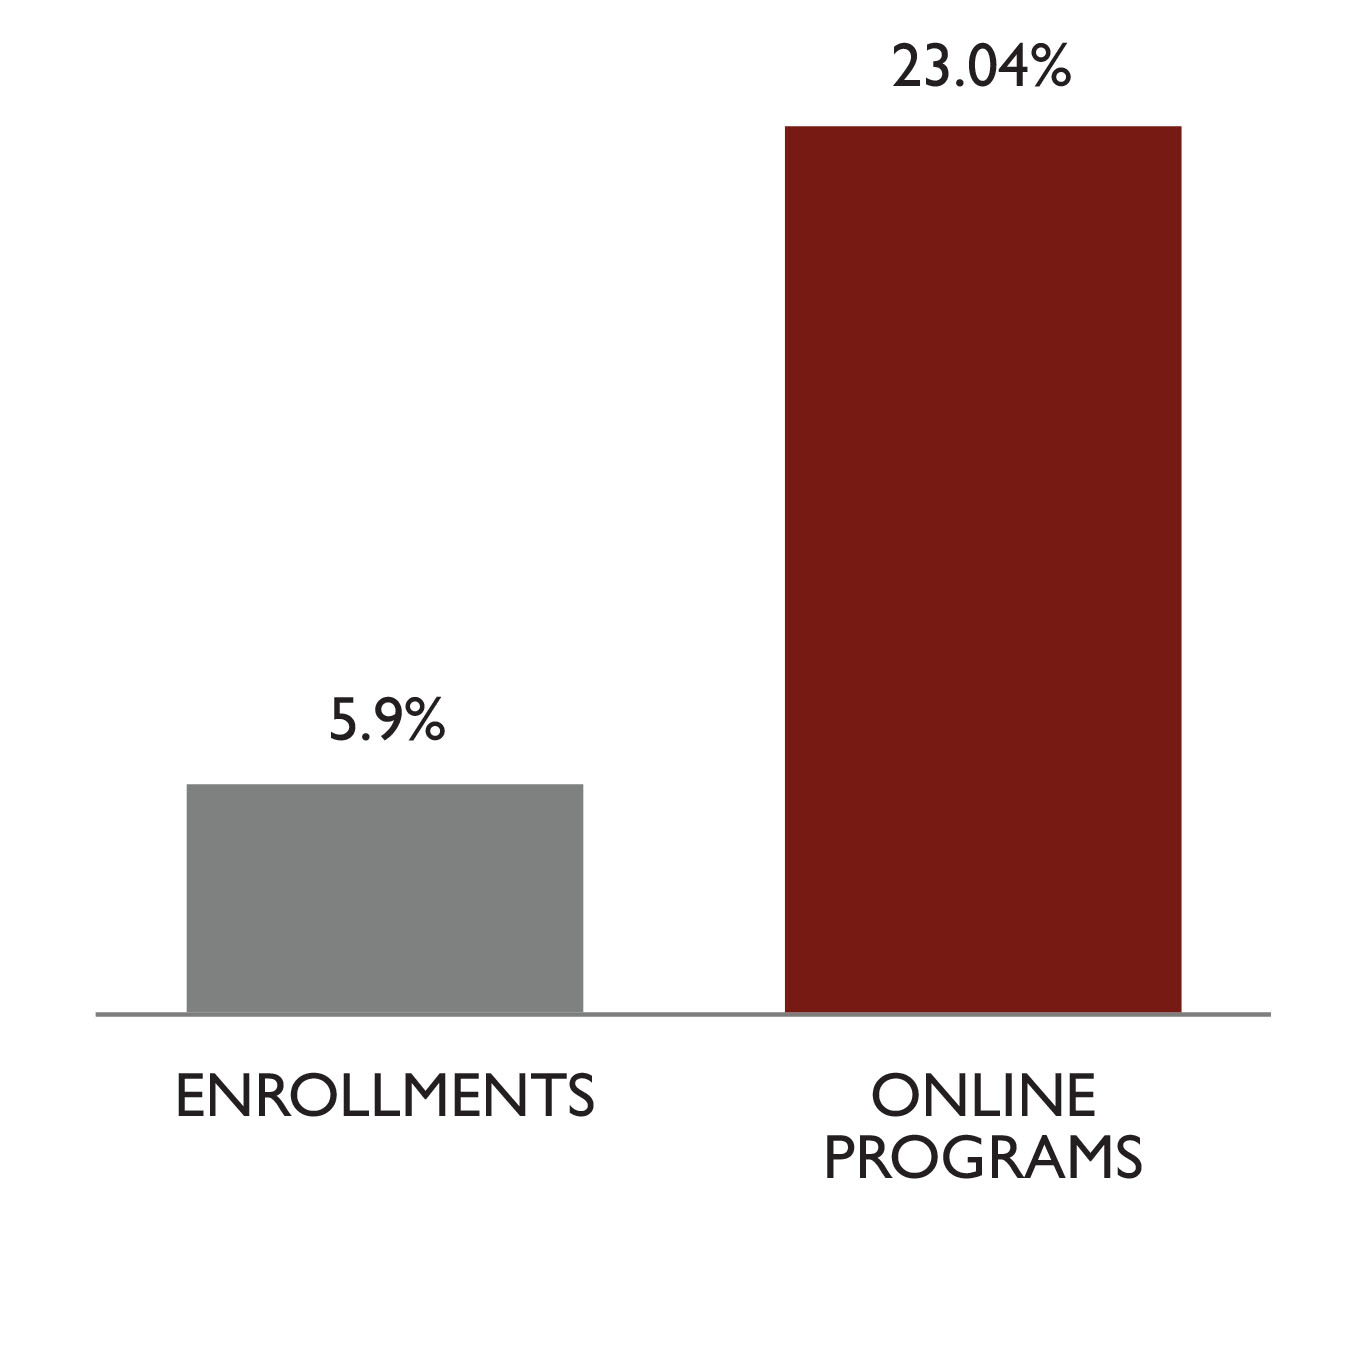 Source: IPEDS exclusive distance education enrollment counts and distance education program counts 2013 vs. 2014.
The number of online program offerings continues to outpace student enrollment.
Marketing trends
In addition to the challenging enrollment market, the marketing landscape continues to evolve. Not only do higher education marketers have more tools to balance than ever before, but consumers also have more ways to take in information. Savvy marketers are up for the challenge and deploy innovative solutions. Leverage the data to ensure your campaigns will produce positive results.
Mobile usage continues to increase while desktop and tablet usage is declining. It’s important to rank as high as possible in search results, which directly improves click-through rates. As prospective students get deeper into their consideration set, click-through rates for branded terms increase. Competition on nonbrand, degree- and program-related terms continues to drive the price. We are still seeing lifts in search spending as marketers invest in these more targeted keywords. Users are searching for specific programs.
Schools continue to invest in TV but are decreasing spend and/or shifting their dollars. Contrary to last year, the only growth is in overnights where institutions are investing the money they are taking out of early mornings. This could be a result of course correcting or cost-consciousness. It seems schools are taking a more focused approach to marketing, though TV does still play a big part in driving overall marketing efforts.
Social media is the big mover this year and has become an essential component of the modern marketing mix.
What is the advertising expense as a percentage of revenue for select for-profit institutions?
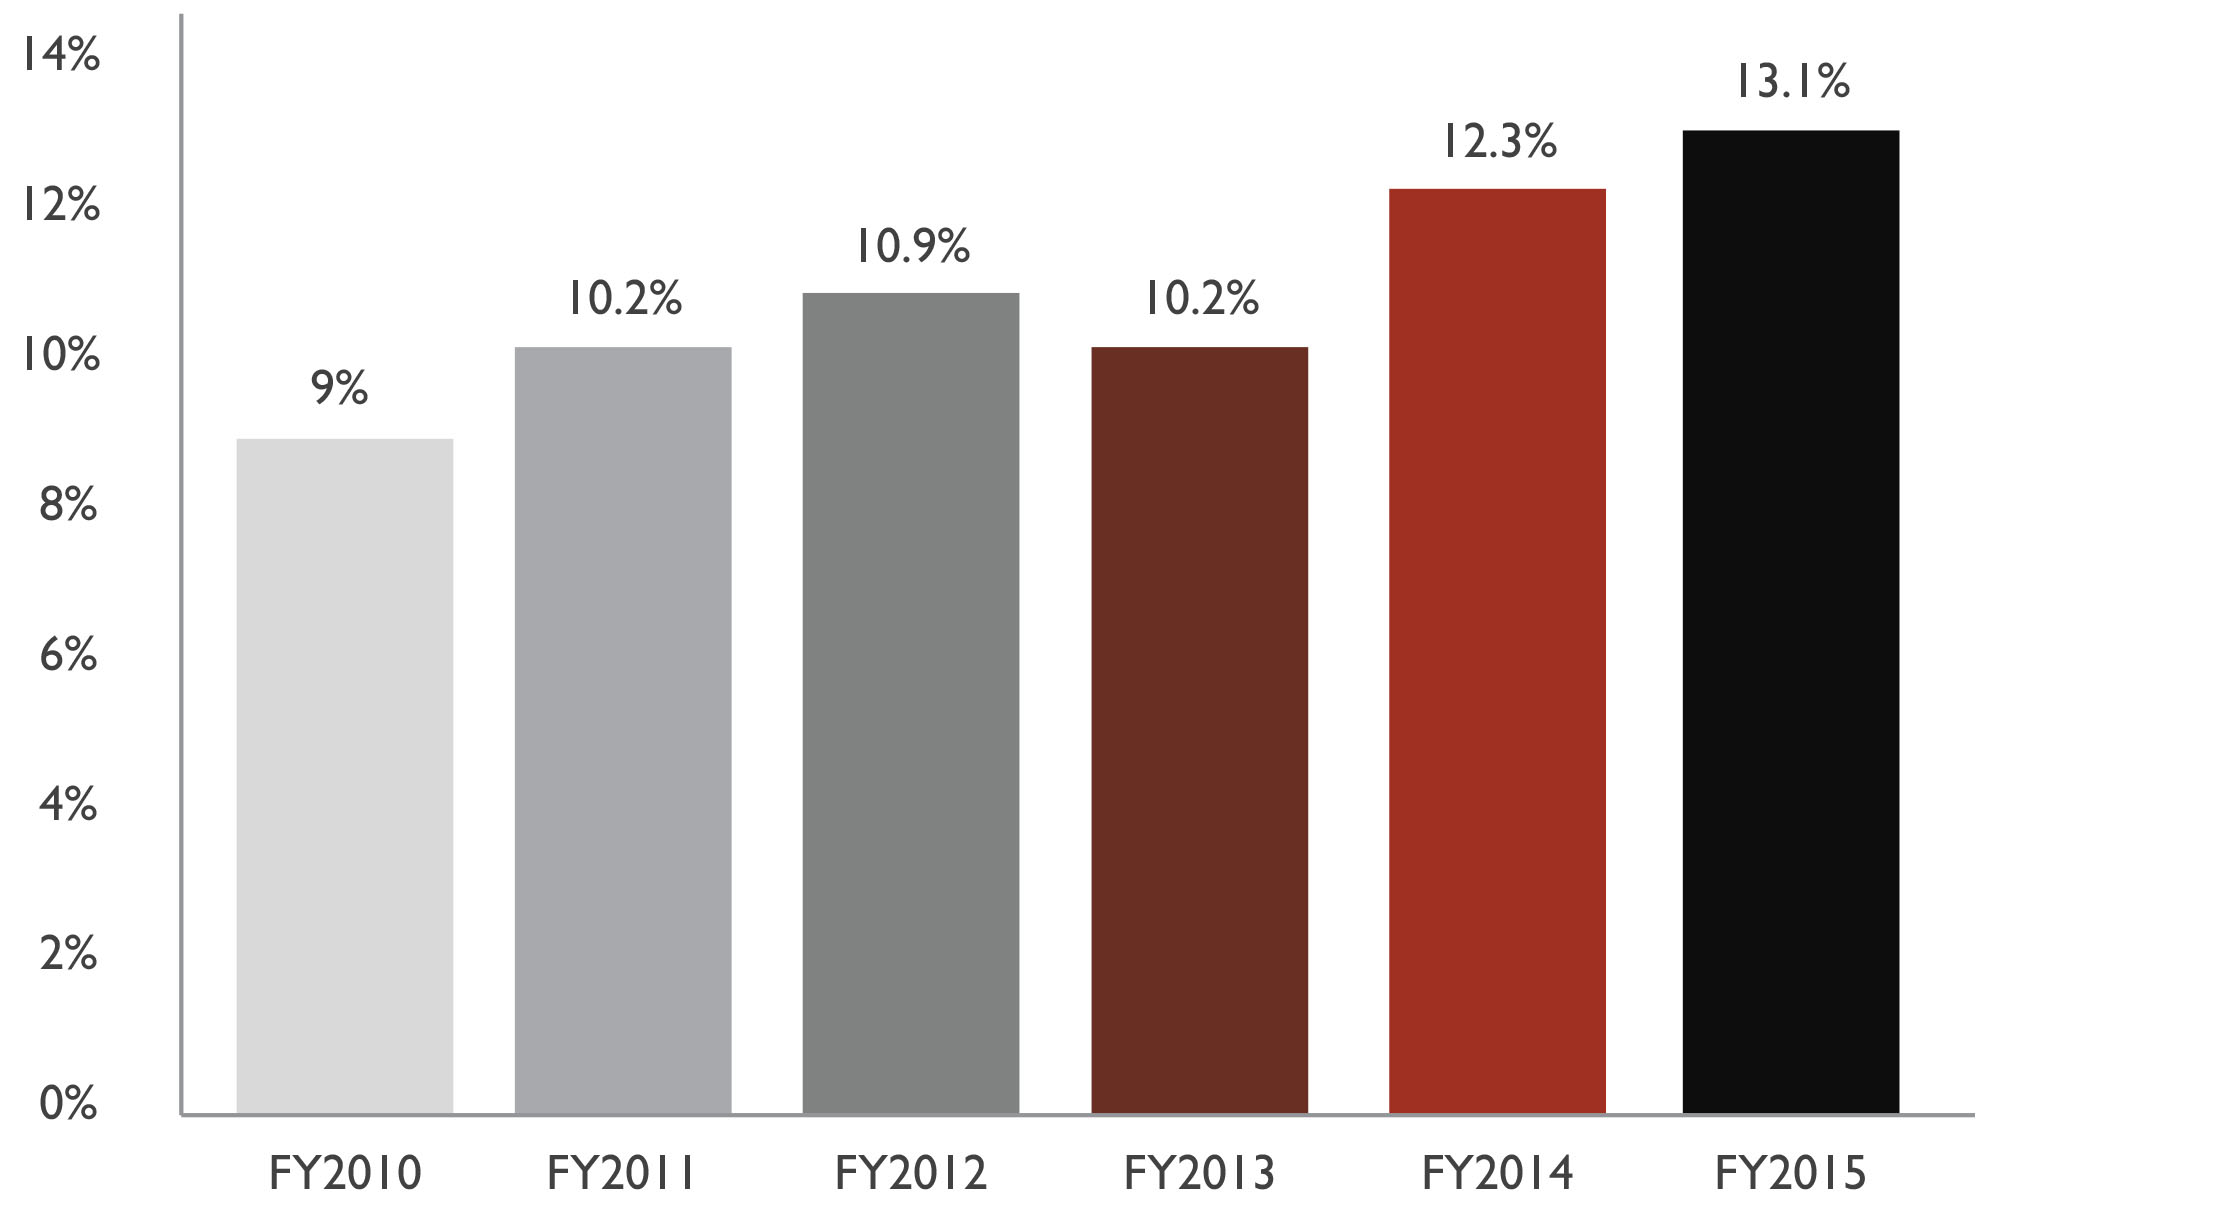 Source: BMO Capital Markets September 2015 Education and Training Report, Exhibit 249, including BMO Capital Market estimates and publicly traded for-profit company reports.
Competitive pressures from the nonprofit sector have not allowed for-profit schools to reduce their marketing spend.
What is the brand versus nonbrand cost-per-click average?
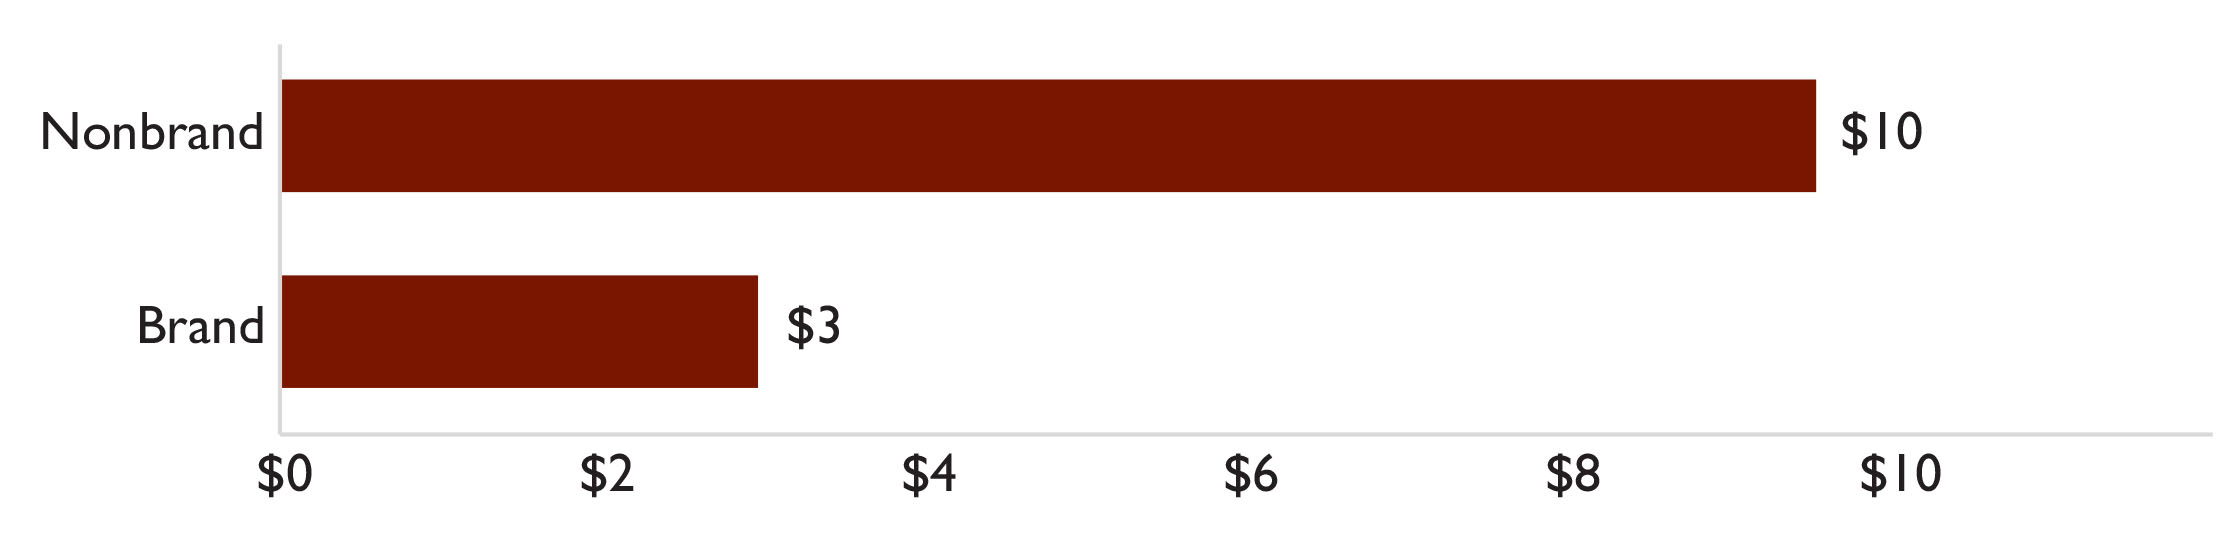
Source: Keypath Education, proprietary client list. Periods measured January 2009-December 2015.
Overall CPCs have risen as a result of Google increasing its minimums, according to Search Engine Land. This had the largest effect on brand CPC, driving advertisers’ branded keywords higher.
Program trends
Armed with the right internal and market data, you can make informed decisions when evaluating your program portfolio. In December 2015, we partnered with Gray Associates to deliver the webinar, “Selecting Your Program Portfolio: A 360-Degree View.” We analyzed the top academic programs based on student demand, employment data, competitive intensity and social media buzz.
For the 2016 benchmarks, we are breaking it down even further. We list the Top 10 programs overall and compare costs per inquiry, costs per click, click-through rate and volume of weekly social media mentions to see what programs people are talking about.
An undeniable trend is the continued growth in healthcare-related program demand. Click-through rates show truck driving continues to have a lot of demand as well. Computer science, marketing, and accounting and finance are experiencing the highest costs per inquiry.
What are the Top 10 academic programs overall?
- Registered Nursing (RN)
- Psychology
- Early Childhood Education
- Accounting
- Computer Science
- Marketing
- Dental Hygiene
- Healthcare Administration
- Truck Driver/CDL
- Medical Assistant
Source: Gray Associates’ Program Evaluation System, 2015.
What are the average costs per inquiry by area of study?
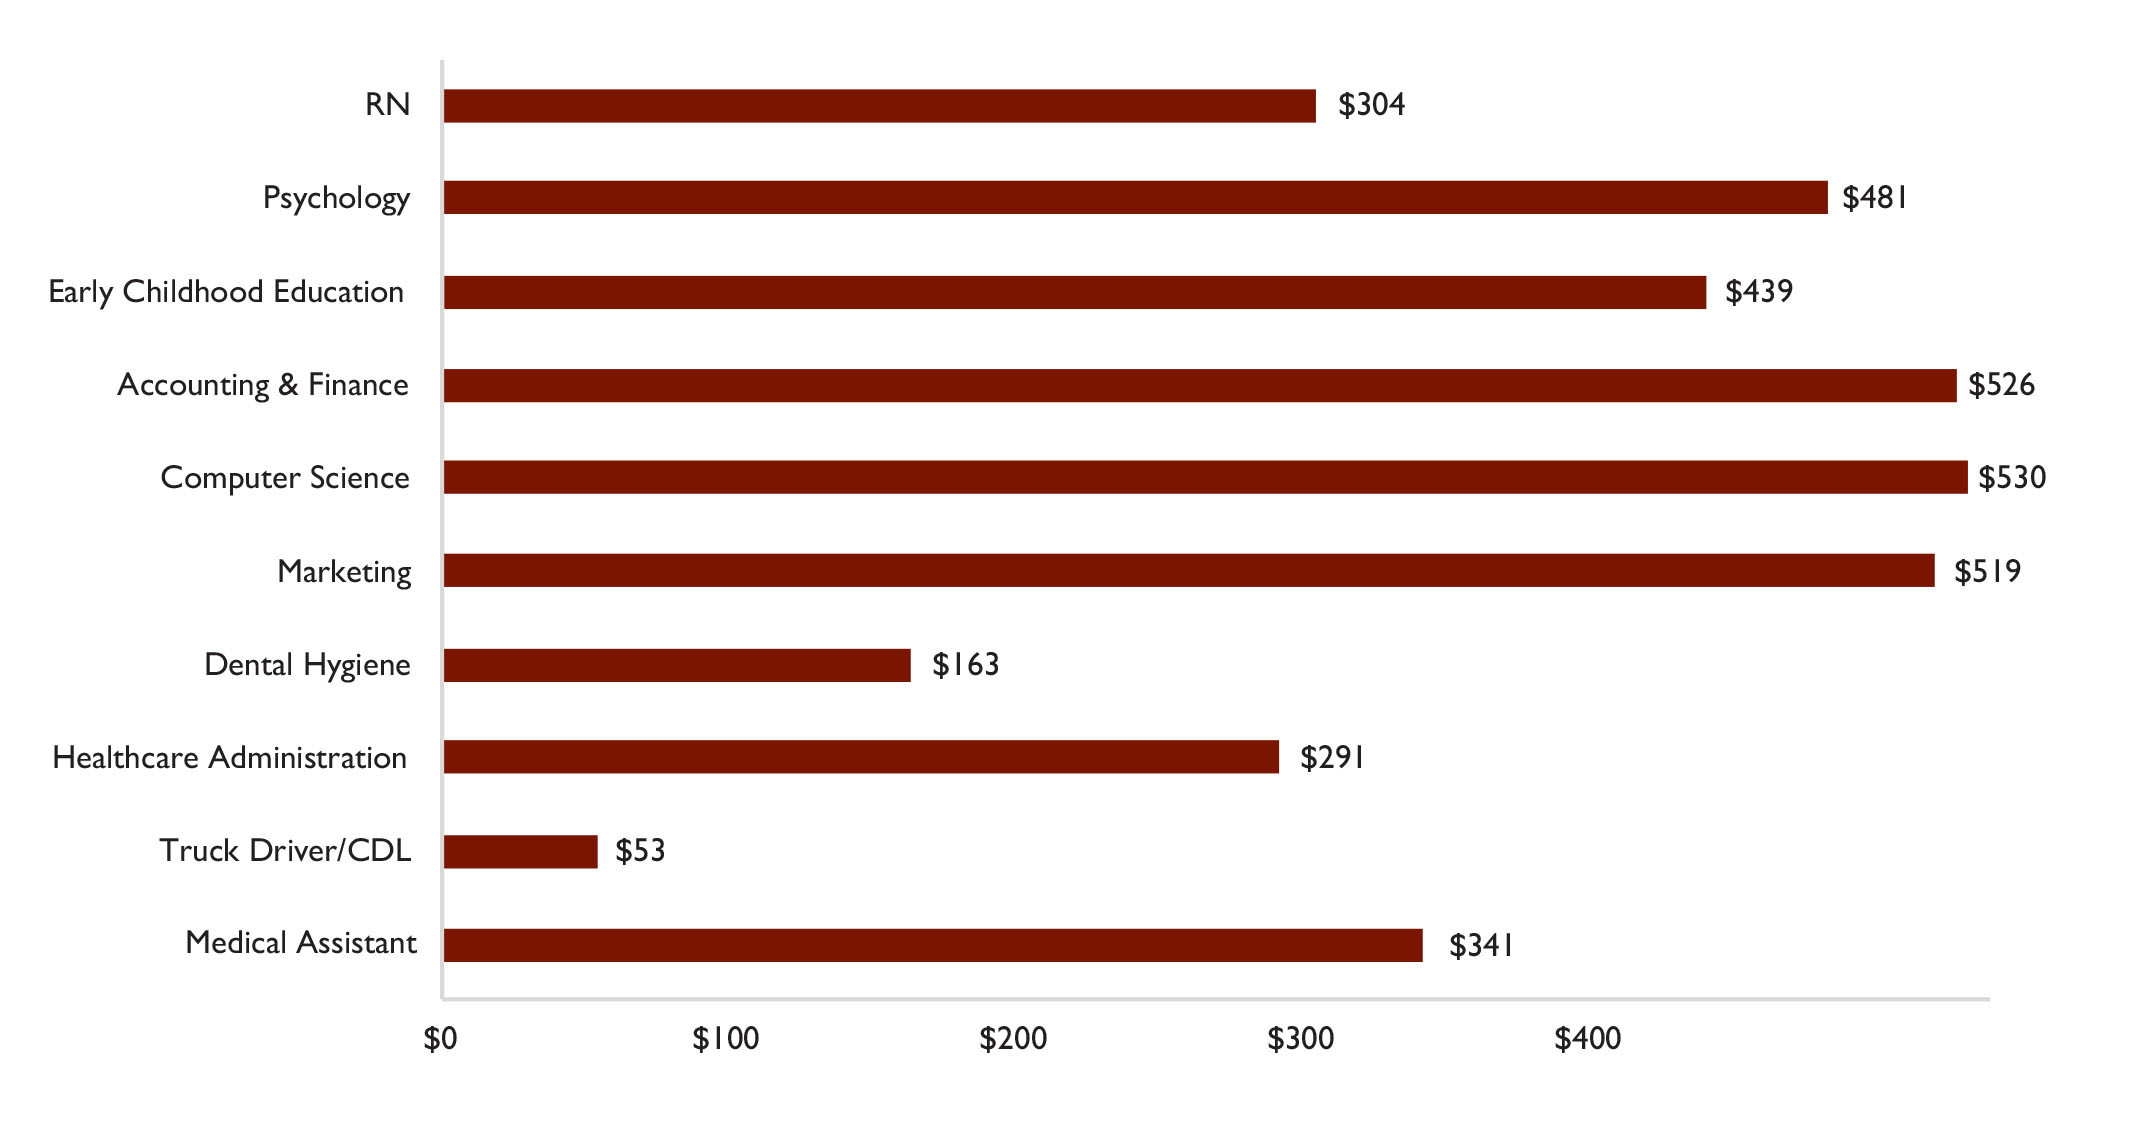
Source: Keypath Education, proprietary client list, excludes brand and generic keywords. Periods measured January 2015-December 2015.
Conclusion
Overall, 2015 represented a continuation of a number of trends we have been seeing for several years. Mobile and social continue to dominate the marketing landscape, and online education is cannibalizing on-ground programs. In the next year, we expect to see increased emphasis on content marketing strategies and more CRM marketing programs to combat the escalating acquisition costs in paid search and reverse the decline in conversion rates.
To download the full white paper go to http://key.pe/25NWVoB.
About Keypath Education Keypath Education, formerly PlattForm, partners with higher education institutions worldwide to launch programs, grow enrollment, improve learning and connect education to careers. The company has helped more than 4,000 higher education institutions better serve students and graduates, resulting in a strong reputation for its education mission and quality in the United States, Canada, the U.K. and Australia. Since its beginning more than 26 years ago, Keypath Education has been dedicated to changing lives through education. Visit keypathedu.com to learn more.