


By Martin Lind, Director, Education Vertical, Velocify and Liz Dye, Director of Marketing Analytics, Sparkroom
What really happens after a student prospect clicks “submit” on an inquiry form? The Sparkroom and Velocify teams decided to delve into the journey of student inquiry submissions to find out.
Though we had anecdotal knowledge of school contact strategies, we could not confidently declare the volume of calls or emails a typical prospect would receive. We wanted to quantify school contact strategies across a statistically significant sample to understand the third-party process, along with possible inquiry reselling, and compare that to best practices.
Sparkroom created contact profiles for 100 student prospects, submitted inquiries on their behalf to schools via third-party sites and tracked, with the assistance of Velocify technology, the phone and email responses they received for the next 90 days. During the study period, we received 3,629 phone calls and 1,522 emails from a combination of schools, education-related companies, employment related companies, vendors and a variety of companies outside of these fields.
Methodology
The Sparkroom team submitted test inquiries from 100 individuals via various third-party channels and measured the follow-up contact attempts from schools and other parties for the subsequent 90 days.
| Total inquiries submitted | 159 |
| Unique inquirers | 100 |
| Average inquiries per inquirer* | 1.62 |
| Maximum inquiries per inquirer | 4 |
| Total schools tested | 73 |
| Average inquiries submitted per school | 2.17 |
| Minimum inquiries per school | 1 |
| Maximum inquiries per school | 11 |
| Total third-party companies tested | 26 |
| Average inquiries submitted per company | 6.11 |
| Maximum inquiries per company | 12 |
* Average inquiries per inquirer is not equal to total inquiries submitted divided by unique inquirers because of a variety of factors that occurred during the inquiry submission process, including call center inquiries that were not able to be completed because of no matching programs available and inability to transfer the call.
Why did we submit multiple inquiries per prospect? Because we wanted them to behave like typical prospective students. In the real world, the share of prospects submitting only one inquiry declined from 49 percent in the first quarter of 2014 to just 43 percent in the first quarter of 2015. This means that more than half of all prospects are not “unique” or “exclusive,” resulting in an extremely competitive environment for schools.
Aggregated results
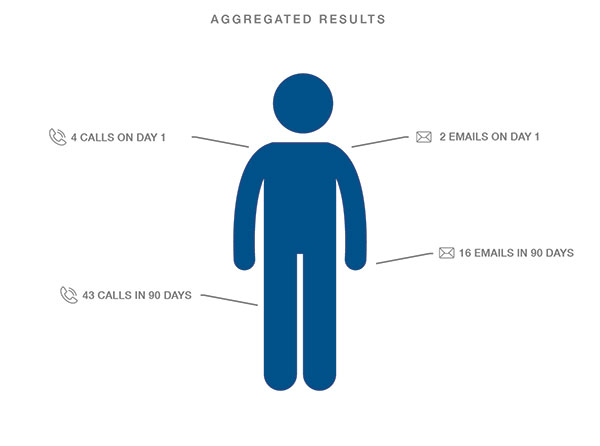
Of the prospects who submitted at least one inquiry, 76 of 100 received at least one contact attempt during the tracking period. For those who did not receive a contact attempt, the cause could have been one of several common reasons: failure to meet enrollment criteria as determined by form responses, being identified as a low-quality prospect by school scoring models, rejection at the aggregator level that would prevent delivery, being flagged by a third-party verification tool, among others.
The average prospect received four phone calls and two emails the day the inquiry was submitted and 43 calls plus 16 emails within our 90-day tracking period. The first phone call was received, on average, 75 minutes after inquiry submission.
The vast majority of calls came from schools, with a relatively low share of calls identified as non-education or non-job-related.
About half of the emails came from schools, including specific admissions representatives at those schools. An additional 41 percent came from vendors. This is a significantly larger quantity of emails than the share of phone calls from this group. The undesirable non-education or job-related category was comparable to call attempts—just 4 percent of the total.
Speed to lead
Schools (and their call centers) are quick to place calls to their prospects because speed impacts the performance of enrollment campaigns. In fact, most prospective students expect to receive a call within 24 hours of completing an inquiry form, and 70 percent of prospects believe the first school to call them has an advantage over the competition1. Quick, thoughtful attention from a school representative can build confidence, attachment and interest in the school. Information shared about a school will have a much better chance of getting traction if it is delivered to prospective students within minutes of their inquiry submissions, when they are still thinking about the school and before competing schools have an opportunity to pitch the benefits of their programs. This quick response also tells a prospective student that the school cares about them: “If they are this responsive to my needs now, they’ll be responsive to my needs when I’m a student.”
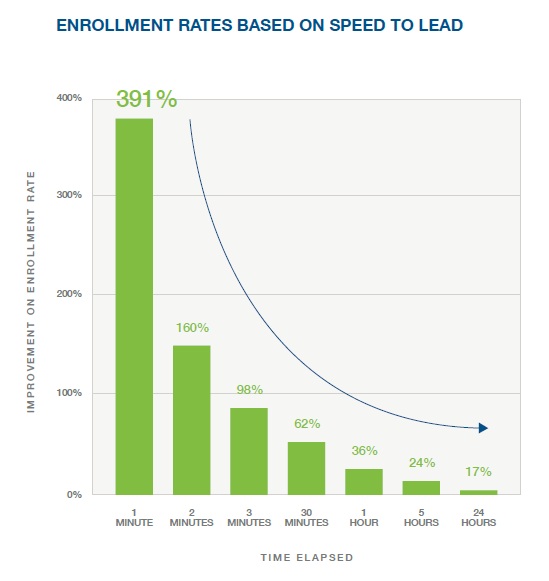
A slow response can create a negative impression and decrease the probability of enrollment. Research has shown that a contact attempt within one minute of inquiry submission increases the likelihood of that prospect turning into an enrolled student by 391 percent2.
On the day the inquiries were submitted, the “speed to lead,” or how quickly a prospect was called after an inquiry submission, was impressive. Approximately 82 percent of prospects were contacted on the day of their inquiry submissions. More than one-sixth of prospects were called within five minutes of their inquiry and more than one-third within the first 30 minutes after inquiry. Every prospect contacted on the first day was called within the first 12 hours.
Day 1 speed to lead phone contact
- Contacted within 5 minutes of inquiry submission – 17.6 percent
- Within 30 minutes – 35.9 percent
- Within 1 hour – 40.5 percent
- Within 8 hours – 92.9 percent
- Within 12 hours – 100 percent
Persistence
Phone Calls
During our 90-day tracking period, our prospects received a total of 3,629 calls. This is an average of 7.6 calls per caller per inquirer. The vast majority of prospects (94 percent) received 111 or fewer calls, but five of our outlier prospects received 172 calls or more.
During the first five days of the study, more than 1,000 phone calls were placed, and 72 of 76 prospects received at least one call. Over the next 15 days, both the number of phone calls being placed and the number of individuals receiving calls dropped off substantially. There’s a long tail of prospects that continued to receive calls from education and affiliate organizations well after the first 15 days, but the bulk of the contact attempts happened close to the inquiry event. Day one resulted in 69 prospects contacted, 281 calls received and 40 voicemails.
Thirty days into the study, only 25 prospects were still receiving phone calls, and just 100 calls were received every five days. At day 55, there was a slight bump – 100 calls were placed, on that day alone, to a total of 27 prospects. The calls quickly tapered off more dramatically after that. By the end of the 90-day period, only 15 prospects were still receiving phone calls, and the volume had dropped considerably.
The Velocify team looked at data on the progression of millions of prospective students to uncover the optimal number of call attempts. The research shows 93 percent of prospects that eventually enroll have been contacted by the sixth call attempt3.
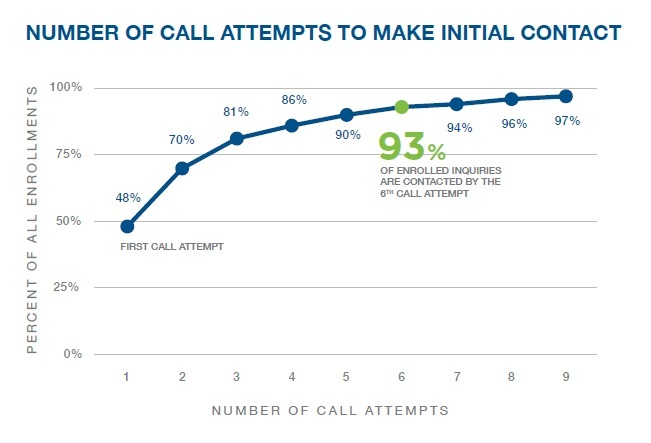
When schools continue to dedicate resources into contacting the remaining 7 percent, it frequently yields diminishing returns, making poor use of admissions teams’ time on unresponsive prospects and running the risk of being perceived as overly aggressive.
In fact, prospects who receive more than six calls from an individual school are 45 percent less likely to enroll than those who receive six calls or less. So while persistence is important, too much can result in annoyance and wasted resources.
Voicemails
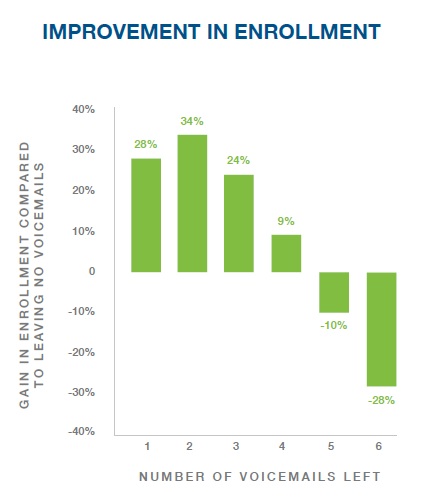
During our study, a total of 367 voicemails were received. That’s an average of 3.46 voicemails per caller per recipient – right in line with best practices.
According to Velocify research, leaving two voicemails increases likelihood of enrollment by 34 percent compared to not leaving a voicemail. However, leaving more than four voicemails is actually worse than not leaving a single voicemail.
Emails
During the tracking period, our prospects received a total of 1,522 emails. That’s about four emails per sender per recipient. Almost all prospects received 49 emails or fewer, but there was one outlier who racked up 148 emails during the 90-day period.
Velocify research found that in order to maximize the probability of enrollment, schools should send five emails in a 22-day period4. While inquiring students might prefer fewer, because some emails get ignored or routed to a spam folder, this volume is necessary to achieve optimal enrollment.
Unlike the phone calls received, the email volume fluctuated considerably as we continued to track it. More than 200 emails were sent within the first five days, but then email volume dropped off sharply. Only 80 emails were delivered to a combined 44 recipients during days six through 10.
Email volume fluctuated up and down throughout the remainder of the 90-day period, as shown in the following chart. The number of prospects receiving emails also fluctuates—with peaks in total recipients toward the beginning and the end of the tracking period. Because email is a lower-cost channel, it offers schools more opportunities to reach out to more people over a longer period of time.
Conclusion: Things to Consider
Inquiries are probably not unique: Between prospects submitting multiple inquiries and aggregator re-marketing, the lack of exclusivity carries two implications:
- Most likely, multiple schools are trying to reach any individual prospect at the same time. Schools need to decide if it’s more advantageous to be quick to dial or to figure out how to best differentiate themselves from peers.
- Even when schools are actively engaging with a prospect, this prospect is likely to be shopping for other schools. The time to impress with student experience and service doesn’t end when someone comes in for an interview or submits an application.
Know–and respect–every step of your users’ experience: We hope this study is just a jumping off point for you to truly understand and respect the student inquiry process. Humanizing your unique student experience–understanding what it looks like start to finish–is key to determining the right time, channel and quantity of your outreach attempts.
Focus on effective frequency in contact strategy—learn when enough is enough: Persistence measures how many contact attempts are made to a student prospect after an inquiry. A gut feeling may make it easy to rationalize the extremes of too many or too few contact attempts, but the key to a successful contact strategy is to make the optimal number of call attempts and emails. After comparing millions of inquiry records, research has determined that six calls and five emails deliver the best results.
Think holistically: This study focused on calls and emails, but you should consider other channels that are visible to student prospects. Your media plan must start with awareness and continue through conversion and beyond, delivering a relevant, consistent message every step of the way. Anything less than that will fall short of your prospects’ expectations and could impact their ultimate enrollment decisions.
*For a copy of the complete study and additional findings, go to: www.sparkroom.com/lifecycle
About Sparkroom
Winner of the “Best Marketing Agency” in education LEADER Award from LeadsCouncil, Sparkroom is the leader in performance marketing for the higher education industry. We provide fully transparent, analytics-based strategies that are designed to do one thing—achieve your enrollment marketing objectives.
Sparkroom knows what it takes to attract the right students to your brand while managing recruitment costs. Our superior combination of marketing services and industry-leading marketing software gives schools a competitive advantage, allowing for improved efficacy of marketing campaigns.
Sparkroom Marketing Services leverages our years of digital marketing experience and higher education expertise to create customized marketing strategies based on your unique objectives. We work as an extension of your marketing team, off-loading day-to-day marketing management tasks while providing strategic solutions and resources. Our marketing analytics team provides an in-depth look at how inquiries are performing to allow schools to better understand and optimize their enrollment campaigns while making smarter, performance-based decisions.
Sparkroom Marketing Software processes an average of one million inquiries each month. Sparkroom Marketing Software is cloud-based and helps marketers grow enrollments while controlling the cost of student acquisition. It integrates marketing data, automates marketing processes and provides analytics that drive smarter decisions and a more optimized budget.
For more details about Sparkroom, go to Sparkroom.com or call 877.423.1366.
About Velocify
Velocify is a market-leading provider of cloud-based intelligent enrollment management software designed for schools that compete for students. Velocify accelerates performance—driving rapid inquiry response, increased discipline, improved productivity and unique enrollment management insights. The company has helped more than 1,500 organizations across a variety of industries, becoming the platform of choice for organizations focused on improving enrollment rates, customer acquisition practices and performance.
For more information, visit Velocify.com/HigherEd.
References
1Zogby Analytics, Online Prospect Expectations (http://pages.velocify.com/OnlineProspectExpectations.html)
2Velocify, The Ultimate Contact Strategy (http://pages.velocify.com/rs/leads360/images/Ultimate-Contact-Strategy-Edu.pdf)
3Velocify, The Ultimate Contact Strategy (http://pages.velocify.com/rs/leads360/images/Ultimate-Contact-Strategy-Edu.pdf)
4Velocify, The Ultimate Contact Strategy (http://pages.velocify.com/rs/leads360/images/Ultimate-Contact-Strategy-Edu.pdf)