
Best Practices for Managing the Program Portfolio


By Bob Atkins, CEO and Founder, Gray Associates
Introduction
A great gardener must constantly decide what to prune and what to plant. Every year, great schools decide which programs to Stop, Start, Sustain, and Grow.
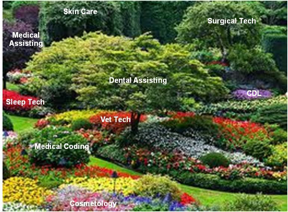
These choices are among the most important and difficult strategic decisions an education provider can make. An outdated program portfolio may include small programs that can be grown into big, successful programs. Once great programs may now have limited student demand or jobs for graduates. Great new programs may be overlooked. An unfocused portfolio may have a scattering of small programs that are difficult and expensive to manage.
It is not easy to decide where to invest and where to cut. Some high-performing programs need more investment of attention and money to grow; others may have saturated their markets. Some weak performers are in poor markets where additional investment would be wasted; others are in good markets, where investment may be richly rewarded. To make matters more complex, current programs compete with potential new programs for money, time, and management attention. As a result, optimizing an institution’s portfolio requires a comprehensive look at all current and all potential programs.
Over the last few years, Gray has worked with its clients to develop the data and tools to enable efficient and comprehensive program assessments. The following fictional case study illustrates this program portfolio planning process.1 So, please meet Sarah Hill, CEO of Reliance Institute, and watch as she deals with her program portfolio challenges.
Program Scan and Assessment Case Study
The situation
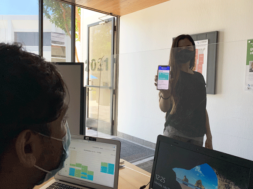
Sarah Hill, CEO of Reliance Institute, pondered the challenge in front of her. Her Board had given her a clear mandate either to fix some weak programs, or to replace them with programs with better prospects. However, Sarah was having trouble deciding whether those weak programs really were fixable. And Reliance had mixed success introducing new programs in the past.
“How can we improve our odds of success this time?” she asked herself. “That Massage Therapy program in Akron has not attracted enough students. And students loved the Veterinary Tech program in Springfield, but we were not able to place enough of them.”
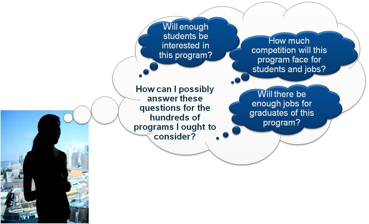
Sarah was resourceful, and she started to write down ideas for doing this better. But then she stopped: “How can we possibly do a full analysis of every current and new program? And if we do not look at all programs, how can we be confident that we are choosing the best ones?”
Figuring out what to do
Sarah began searching for a white paper she had gotten from Gray Associates. She recalled it was about studying a specific program in great detail, but she thought, “If they know how to evaluate one program, maybe they know how to assess a whole portfolio.” So she called a partner there, Steve Probst.
After some initial pleasantries, Sarah explained her situation and asked Steve if he could help her evaluate a few programs for Reliance’s largest campus. She was a little shocked when Steve said that it might be easier—and better—to look at every possible program for each of Reliance’s campuses. Steve called this a “Program Scan” and said it was a critical part of program portfolio planning.
Getting good data on student demand
Skeptical that anyone had all the data needed to do a program scan, Sarah asked, “What information do you have on student demand?”
Steve responded, “We have been working with the leading inquiry providers, and we have developed a summary of monthly student inquiries by program, for every city in the U.S. For example, we know how many inquiries there are for Bookkeeping in Altoona, and we know how that compares to a year ago. Right now, the database includes about 20 million inquiries for over 200 academic programs.”
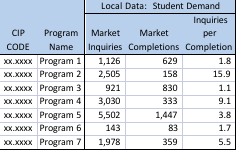
“We often look at these inquiries in two ways,” Steve continued. “First, we look at the absolute number of leads, as a gauge of overall demand. Then, we compare leads to completions in that market, to help judge how saturated that market is.”
Sarah said, “If I understand, you can tell me how many inquiries there were for Medical Assistants, or any other program, in Topeka—and if there were already enough schools for them. Is that right?”
“Exactly,” Steve replied. “We can do that.”
Getting good data on employer demand
Sarah now probed on employment. “As you know, we have to be sure our graduates can get jobs. What data does Gray have on employment opportunities?”
Placement data
“Well,” Steve said, “we start by looking at actual placement rates for similar programs in your markets. Many schools are required to report this information now, but actually getting the data is a pain. We have invested in collecting thousands of placement rates. We believe those actual placement rates are the best predictor of how well a similar program is likely to do in the same market.”
Employment data from the bureau of labor statistics
Steve continued, “In addition, we use employment and job-openings data from the federal government. We have driven this data down to the city-level and aligned it by academic program or CIP code. While the raw data on jobs comes from the government, matching those jobs with the appropriate CIPs and properly assigning them to local markets has required months of work. But we now have the data for every market and program in the U.S.”
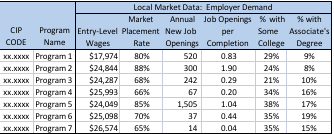
Job saturation
Sarah thought about this for a moment, and then asked, “It seems to me that if we look mostly at job openings, big cities are always going to look best, even if there are tons of people already looking for those jobs there. How do you handle that?”
Steve said, “You are right. So, in addition to looking at job openings, we also help schools look at those openings in comparison with IPEDS completions, to compare the supply and demand for entry-level jobs in each field.”
Job appropriateness
“Do I have to be concerned about inappropriate jobs being counted – burger flippers who do not need our training, or physicians who need a lot more education?” Sarah asked. Steve responded, “We help our clients look at the educational attainment of people currently in those jobs, to make sure that they are relevant for our clients’ graduates. We also recommend looking at entry-level wages, to make sure that our clients’ graduates will be able to earn back the value of their degree once they are placed.”
Sarah was impressed with what she had just heard. It sounded like this could solve part of her problem, by getting her the data she needed. But she still faced the challenge of actually evaluating all those programs for each of her campuses. So she asked, “Tell me about how we can use this information to evaluate our current programs and pick the best new programs for us.”
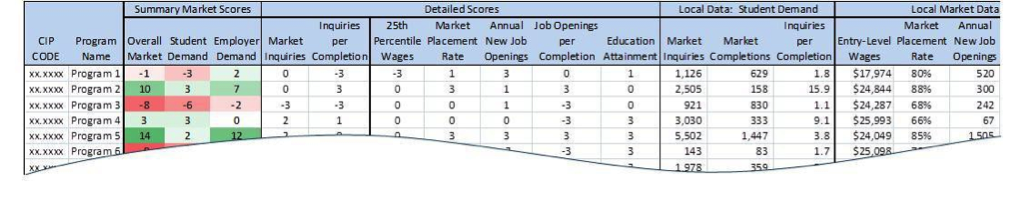
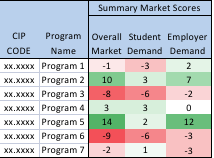
Scoring and ranking each program
“For us, program portfolio planning starts with a program scan, to rank all the potential programs in a given market,” Steve said. The scan enables the management team to pick a few high-scoring programs to investigate further. We have data for hundreds of CIPs that are relevant for postsecondary schools, and we typically rank each of those in each market that a client is interested in. That can be for each of their campuses, or at just the national level.”
“When we provide all this data, we work with each client to come up with a scoring system that reflects their priorities. Using that scoring system, we rate every program based on this full spectrum of information. We then rank-order the programs to highlight the top-scoring opportunities.”
Sarah asked, “So, once all the programs are scored, is that the end of the process?” “That is the end of the program scan, but it is not the end of the portfolio planning process,” Steve replied. “The next steps differ for existing programs and potential new programs.”
Program portfolio planning: new programs
“For new programs, most of our clients use the list of scored and ranked programs as input to a more detailed evaluation of the top few potential new programs.”
- Do some programs score well at more campuses than others do, so that the cost of developing the programs can be spread across more campuses and students?
- Do some programs fit better with the brand image, existing relationships, available facilities, or internal capabilities?
- Does the local campus staff have relevant insights about any of the high-scoring programs?
- What additional insights can be learned from industry experts?
Program portfolio planning: existing programs
Sarah was getting excited about the process. “If we are going to do a scan of all programs, does that mean we are going to score our existing programs, too? What do other schools do with that information?”
Steve responded, “Yes, we would help you evaluate your current programs. It can be very powerful to understand whether a program’s performance is mostly about the person running it, or whether it is driven by particularly strong or weak market conditions. For example, a 70 percent placement rate means one thing when competitors are doing 60 percent, and something else when they are at 85 percent.”
“Also, some of our clients use these rankings to drive some serious strategic decisions. Should this low-performing program be fixed or taught out? Is this solid performer a good candidate for growth, or is it one we should simply maintain as-is?”
Moving beyond the numbers
Sarah thought about what Steve had explained. “It sounds like a lot of information – employer demand, entry-level wages, placement history, actual student inquiry history, and so on. And you help us score every program we are teaching today, plus all the ones that we might want to consider teaching in the future. And we do that for every campus. Is that right?”
Steve said, “That is right. That gives you the ability to understand what is driving every scoring decision, and the information you need when evaluating the actual performance of your current programs today.”
“But I have to caution you,” Steve continued, “that once you have the numbers, that does not mean your work is done.” “What do you mean?” Sarah asked.
Involving the team
“The numbers are one input for your decisions. You also want to get insight and support at the campus level. For example, if a local school recently dropped a similar program, your campus President could call them to find out why. If there are only a few major local employers for a specific program, it may be helpful to talk with them to understand how they see the employment market. As important, you will want to include your local leaders in the decision- making process so they understand and drive the success of your programs.”
“Once you have a clear idea of what programs to invest in at the campus level, there is still additional work to be done. You can only develop and support so many programs; therefore, the preferences of different campuses have to be balanced. You might want to give a higher priority to a potential new program that is a good fit at eight campuses than one that would work well at only two campuses.”
Getting started
Sarah smiled. Dealing with the Board’s mandate to fix or replace some current poor performers would still be a lot of work. But now she knew how she was going to answer their questions, and she was ready to get started.
Conclusion
The traditional approach to evaluating current programs and picking new programs to launch is too risky for today’s education market. However, not doing this work can lead to a stale program portfolio that limits the education provider’s profit potential. Fortunately, schools can now adopt a program portfolio planning process that systematically ranks essentially all potential programs on relevant data-driven criteria. This provides a defensible, lower-risk basis for adding programs, and a robust set of insights for evaluating current program offerings.
Reference
1 All individuals and educational institutions in the case study are fictional. The GrayMatters data shown is drawn from a variety of public and proprietary sources and is for illustration only.

Bob Atkins, CEO and Founder of Gray Associates, led Gray’s entry into the education industry and the development of Gray’s proprietary industry databases and service offerings. He has worked with all of Gray’s education clients, counseling CEOs and CMOs on business strategy, pricing, location selection, and program strategy. He is an expert in business strategy, marketing, sales, and high-tech distribution channels. He has helped AT&T, Avaya, American Express, Dex Media, Qwest Communications, HP, IBM, Northcentral University, UTI, Alta Colleges, and other clients to develop growth strategies, enter new markets, and build their sales and channel organizations. He has also led efforts that have eliminated tens of millions of dollars in cost, particularly in sales and channel management. He is a published author whose articles have appeared in the Wall Street Journal, Sales and Marketing Management, and other publications around the world. He received an MBA, with honors, from Harvard Business School and a BA, magna cum laude, from Harvard College.
Contact Information: Bob Atkins // CEO and Founder // Gray Associates // Phone: 617-401-7662 // bob.atkins@grayassociates.com